 signoz
SigNoz is an open-source, OpenTelemetry-native observability platform for your team and their AI agents. Get logs, metrics, and traces in one tool with features like APM, distributed tracing, log management, infra monitoring, etc. Combined with SigNoz MCP and a native AI teammate (in SigNoz Cloud) it helps you build more resilient apps.
Top Related Projects

The open and composable observability and data visualization platform. Visualize metrics, logs, and traces from multiple sources like Prometheus, Loki, Elasticsearch, InfluxDB, Postgres and many more.

Your window into all of your data

The Prometheus monitoring system and time series database.

CNCF Jaeger, a Distributed Tracing Platform

APM, Application Performance Monitoring System
Quick Overview
SigNoz is an open-source application performance monitoring (APM) and observability platform. It provides developers with a comprehensive solution for monitoring and troubleshooting their applications, offering features like distributed tracing, metrics, and logs management in a single, unified interface.
Pros
- All-in-one solution for metrics, traces, and logs
- User-friendly interface with customizable dashboards
- Open-source and self-hosted, providing better data control and privacy
- Compatible with OpenTelemetry, making it easy to integrate with existing systems
Cons
- Relatively new project, may have fewer features compared to established commercial APM tools
- Self-hosting requires more setup and maintenance compared to SaaS solutions
- Limited community support and documentation compared to more mature projects
- May require additional resources for deployment and scaling in large environments
Getting Started
To get started with SigNoz, follow these steps:
- Clone the repository:
git clone https://github.com/SigNoz/signoz.git && cd signoz
- Run the install script:
./deploy/docker/install.sh
-
Access the SigNoz UI at
http://localhost:3301 -
To send data to SigNoz, instrument your application with OpenTelemetry. Here's an example for a Node.js application:
const { NodeSDK } = require('@opentelemetry/sdk-node');
const { OTLPTraceExporter } = require('@opentelemetry/exporter-trace-otlp-http');
const { Resource } = require('@opentelemetry/resources');
const { SemanticResourceAttributes } = require('@opentelemetry/semantic-conventions');

const sdk = new NodeSDK({
  resource: new Resource({
    [SemanticResourceAttributes.SERVICE_NAME]: 'my-service',
  }),
  traceExporter: new OTLPTraceExporter({
    url: 'http://localhost:4318/v1/traces',
  }),
});

sdk.start();
For more detailed instructions and language-specific examples, refer to the SigNoz documentation.
Competitor Comparisons
The open and composable observability and data visualization platform. Visualize metrics, logs, and traces from multiple sources like Prometheus, Loki, Elasticsearch, InfluxDB, Postgres and many more.
Pros of Grafana
- Extensive visualization options and customizable dashboards
- Large ecosystem with numerous plugins and integrations
- Mature project with a strong community and extensive documentation
Cons of Grafana
- Steeper learning curve for complex configurations
- Requires additional setup for full observability stack (e.g., Prometheus, Loki)
Code Comparison
Grafana (dashboard configuration):
{
  "panels": [
    {
      "type": "graph",
      "title": "CPU Usage",
      "datasource": "Prometheus",
      "targets": [
        { "expr": "node_cpu_usage_percent" }
      ]
    }
  ]
}
SigNoz (dashboard configuration):
{
  "panels": [
    {
      "type": "timeseries",
      "name": "CPU Usage",
      "query": "SELECT avg(cpu_usage_percent) FROM system_metrics"
    }
  ]
}
Summary
Grafana is a powerful and flexible visualization tool with a vast ecosystem, while SigNoz offers a more integrated, all-in-one observability solution. Grafana excels in customization and third-party integrations but may require more setup time. SigNoz provides a simpler, out-of-the-box experience for full-stack observability but may have fewer advanced features compared to Grafana's extensive plugin ecosystem.
Your window into all of your data
Pros of Kibana
- Mature and widely adopted ecosystem with extensive documentation and community support
- Powerful visualization capabilities and customizable dashboards
- Seamless integration with other Elastic Stack components
Cons of Kibana
- Steep learning curve and complex setup process
- Resource-intensive, especially for large-scale deployments
- Licensing costs for advanced features and enterprise support
Code Comparison
Kibana (JavaScript):
import { i18n } from '@kbn/i18n';
import { CoreSetup, CoreStart, Plugin } from '../../../core/public';
import { KibanaUsageCollectionSetup } from '../../../plugins/usage_collection/public';

export class MyPlugin implements Plugin {
  public setup(core: CoreSetup, plugins: { usageCollection?: KibanaUsageCollectionSetup }) {}
}
SigNoz (TypeScript):
import { Plugin, CoreSetup, CoreStart } from '../../../core/server';
import { PluginInitializerContext } from '../../../core/server';

export class SigNozPlugin implements Plugin {
  constructor(private readonly initializerContext: PluginInitializerContext) {}
  public async setup(core: CoreSetup) {}
}
Both repositories use similar plugin architectures, but SigNoz employs TypeScript for improved type safety. Kibana's codebase is more extensive due to its longer development history and broader feature set.
The Prometheus monitoring system and time series database.
Pros of Prometheus
- Mature and widely adopted monitoring system with extensive ecosystem support
- Powerful query language (PromQL) for flexible data analysis
- Built-in alerting capabilities
Cons of Prometheus
- Steep learning curve for complex setups and configurations
- Limited long-term storage options without additional components
- Lacks built-in distributed tracing functionality
Code Comparison
Prometheus configuration (prometheus.yml):
global:
  scrape_interval: 15s

scrape_configs:
  - job_name: 'example'
    static_configs:
      - targets: ['localhost:8080']
SigNoz configuration (docker-compose.yml):
version: '3'
services:
  clickhouse:
    image: clickhouse/clickhouse-server:22.8.8
  otel-collector:
    image: signoz/otel-collector:0.76.1
  query-service:
    image: signoz/query-service:0.25.0
  frontend:
    image: signoz/frontend:0.25.0
SigNoz offers a more integrated approach with distributed tracing and metrics in a single platform, while Prometheus focuses primarily on metrics monitoring. Prometheus has a larger community and ecosystem, but SigNoz provides an easier setup for full-stack observability. Both have their strengths, and the choice depends on specific monitoring requirements and infrastructure complexity.
CNCF Jaeger, a Distributed Tracing Platform
Pros of Jaeger
- More mature and widely adopted in the industry
- Supports multiple storage backends (Cassandra, Elasticsearch, etc.)
- Extensive documentation and community support
Cons of Jaeger
- Requires additional components for a complete observability stack
- Steeper learning curve for beginners
- Limited built-in analytics and visualization capabilities
Code Comparison
Jaeger (Go):
tracer, closer := jaeger.NewTracer(
    "my-service",
    jaeger.NewConstSampler(true),
    jaeger.NewInMemoryReporter(),
)
defer closer.Close()
SigNoz (JavaScript):
const tracer = new opentelemetry.NodeTracerProvider({
  resource: new opentelemetry.Resource({
    [opentelemetry.SemanticResourceAttributes.SERVICE_NAME]: 'my-service',
  }),
});
tracer.register();
Both Jaeger and SigNoz are open-source distributed tracing systems, but they differ in their approach and features. Jaeger is a more established project with broader adoption and flexibility in storage options. However, it may require additional setup for a complete observability solution.
SigNoz, on the other hand, aims to provide a more comprehensive out-of-the-box experience with integrated metrics, traces, and logs. It offers a user-friendly interface and built-in analytics, making it easier for beginners to get started. However, it may have fewer storage options and a smaller community compared to Jaeger.
The code examples show the initialization of tracers in both systems, highlighting the different approaches and languages used (Go for Jaeger, JavaScript for SigNoz).
APM, Application Performance Monitoring System
Pros of Skywalking
- More mature project with a larger community and ecosystem
- Supports a wider range of programming languages and frameworks
- Offers more advanced features like service mesh observability and continuous profiling
Cons of Skywalking
- Steeper learning curve and more complex setup process
- Requires more resources to run and maintain
- UI can be overwhelming for beginners due to its extensive features
Code Comparison
SigNoz (JavaScript):
const { trace } = require('@opentelemetry/api');
const tracer = trace.getTracer('my-service');

tracer.startActiveSpan('my-operation', (span) => {
  // Your code here
  span.end();
});
Skywalking (Java):
import org.apache.skywalking.apm.toolkit.trace.ActiveSpan;
import org.apache.skywalking.apm.toolkit.trace.TraceContext;

ActiveSpan.tag("key", "value");
String traceId = TraceContext.traceId();
ActiveSpan.error(new RuntimeException("Something wrong"));
Both SigNoz and Skywalking are open-source application performance monitoring (APM) tools. SigNoz focuses on simplicity and ease of use, making it a good choice for smaller teams or those new to observability. Skywalking offers more advanced features and broader language support, suitable for larger enterprises with complex infrastructures. The code examples show how to create and manage spans in each system, with Skywalking providing more built-in functionality for tagging and error handling.
Convert  designs to code with AI
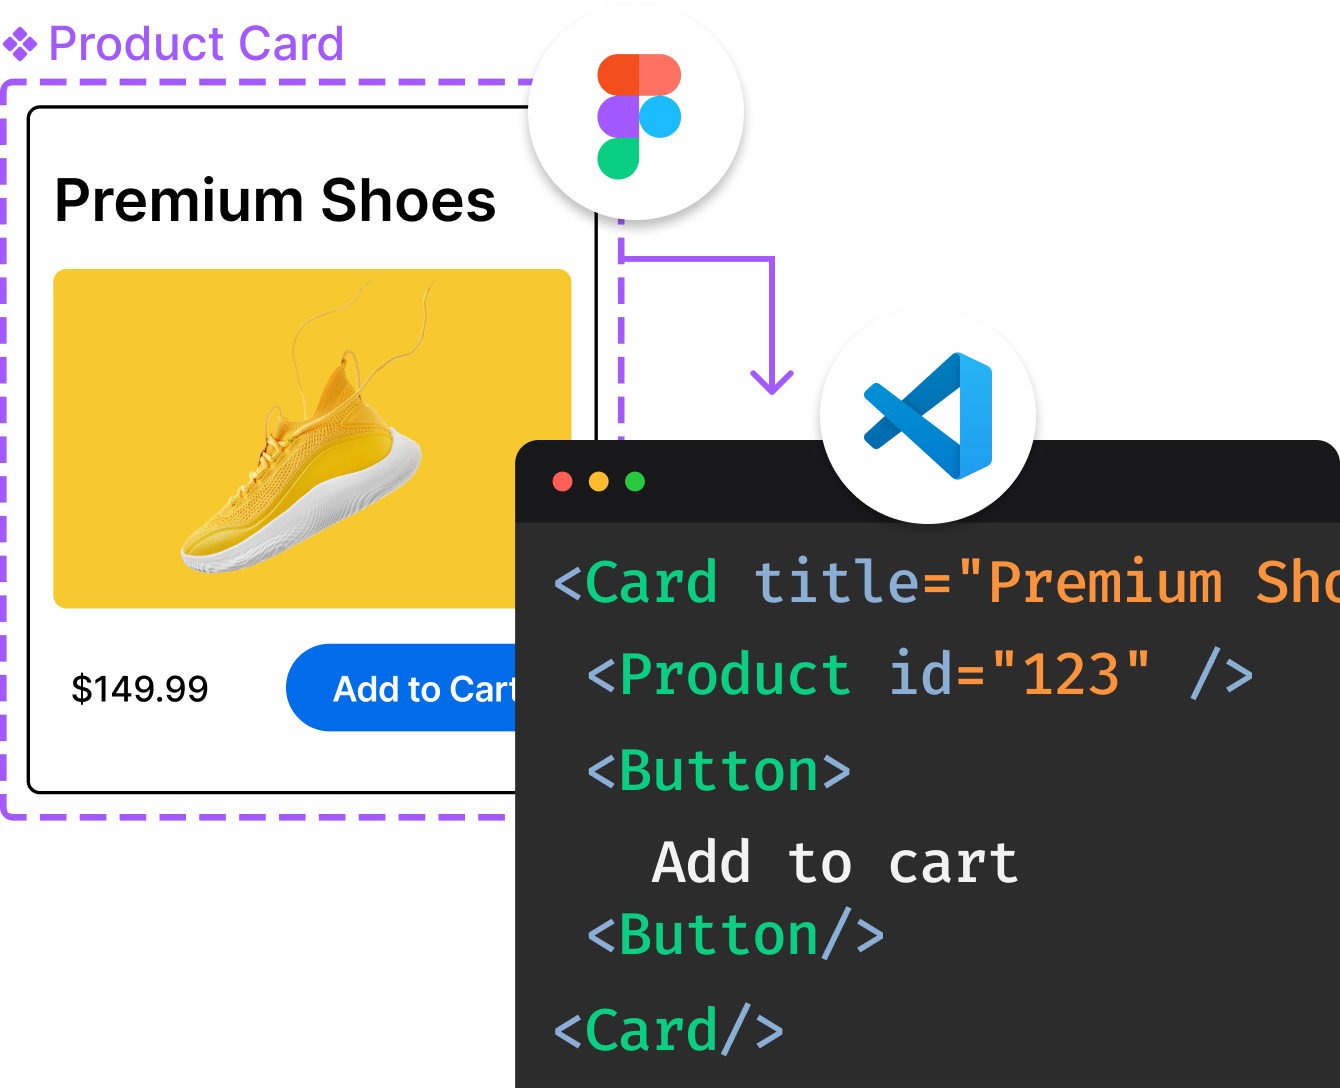
Introducing Visual Copilot: A new AI model to turn Figma designs to high quality code using your components.
Try Visual CopilotREADME

ä¸æ · Deutsch · Português





SigNoz is an open-source observability platform built on OpenTelemetry. Weâre building an enterprise-grade alternative to fragmented monitoring stacks, with logs, metrics, traces, alerts, and dashboards in one place.
Choose how to run SigNoz
SigNoz Cloud (Recommended)
Fully managed SigNoz with a 30-day free trial, no credit card required, usage-based pricing that starts at $49, and regional data hosting.
Enterprise
Enterprise Cloud, BYOC, or Enterprise Self-Hosted with compliance, support, custom retention, RBAC, ingestion controls, data residency, and region selection.
Community
Free open-source SigNoz that runs in your own infrastructure. Deploy with Docker, Kubernetes, or Linux and keep full control of your data plane.
What can you monitor?
SigNoz helps teams debug production issues faster by connecting logs, metrics, traces, alerts, dashboards, exceptions, and agent-native workflows in one place.
APM Overview
Monitor service latency, error rate, throughput, Apdex, top endpoints, database calls, and external calls.

Learn more: APM documentation
Log Management
Ingest, search, aggregate, and correlate logs with traces and metrics using a visual query builder.

Learn more: Log management documentation
Metrics and Dashboards
Build dashboards for application, infrastructure, and custom metrics using Query Builder, PromQL, or ClickHouse SQL.

Learn more: Metrics documentation
Infrastructure Monitoring
Monitor Kubernetes clusters, pods, nodes, workloads, and host-level CPU, memory, disk, network, logs, and traces.

Learn more: Infrastructure monitoring documentation
LLM and AI Observability
Trace LLM apps, RAG pipelines, prompts, tool calls, tokens, latency, and costs alongside application and infrastructure telemetry.

Learn more: LLM observability documentation
Agent-Native Observability and MCP
Use the SigNoz MCP server to bring telemetry into coding agents, or use Noz inside SigNoz to investigate incidents, tune alerts, and build dashboards with production context. Noz is available only on SigNoz Cloud.

Learn more: SigNoz MCP server docs · Agent skills docs
Distributed Tracing
Follow requests across services with flamegraphs, waterfalls, span events, filters, and trace analytics.

Learn more: Distributed tracing documentation
Trace Funnels
Create funnels from traces to understand request-flow drop-offs, failed transitions, and systemic workflow issues.

Learn more: Trace funnels documentation
Also monitor: exceptions, alerts, external APIs, and integrations for OpenTelemetry, Prometheus, Kubernetes, cloud providers, language SDKs, application frameworks, databases, and LLM tools.
Why teams use SigNoz
- OpenTelemetry-native
Instrument once with open standards and keep ownership of your telemetry. - Correlated signals
Move from service charts to traces, logs, infra metrics, and exceptions without switching tools. - Single columnar database
Built for high-cardinality, high-volume observability workloads. - Predictable pricing
No per-host pricing, no user-seat pricing, and no special pricing for custom metrics. - Enterprise ready
SOC 2 Type II and HIPAA compliance, RBAC, ingestion controls, custom retention, support, BYOC, and self-hosting.
Getting started
Start on Cloud
Create a managed SigNoz workspace and get your first dashboard without running observability infrastructure.
Self-host SigNoz
Run SigNoz in your own infrastructure with Foundry, Docker, Kubernetes, or Linux.
Foundry · Docker · Kubernetes · Linux
Send data
Instrument applications and infrastructure with OpenTelemetry, Prometheus, language SDKs, and integrations.
Instrumentation · Integrations
Comparisons to familiar tools
SigNoz is often adopted by teams moving from a stack of single-purpose tools or commercial platforms with unpredictable pricing.
Prometheus
Good if you just need metrics. SigNoz keeps metrics, logs, traces, dashboards, and alerts together so teams can debug with correlated context.
Jaeger
Jaeger only does distributed tracing. SigNoz adds metrics, logs, trace analytics, dashboards, alerts, exceptions, and trace-to-log workflows.
Elastic
SigNoz uses columnar database for efficient observability analytics and high-cardinality log workloads, with 50% lower resource requirement compared to Elastic during ingestion. Check the detailed study.
Loki
In the linked benchmark, SigNoz indexed all keys in the test setup, while Loki hit max stream errors when more labels were added. Check the detailed study.
Contributing
We â¤ï¸ contributions big or small. Please read CONTRIBUTING.md to get started with making contributions to SigNoz.
Not sure how to get started? Just ping us on #contributing in our slack community.
As always, thanks to our amazing contributors!
Top Related Projects
The open and composable observability and data visualization platform. Visualize metrics, logs, and traces from multiple sources like Prometheus, Loki, Elasticsearch, InfluxDB, Postgres and many more.
Your window into all of your data
The Prometheus monitoring system and time series database.
CNCF Jaeger, a Distributed Tracing Platform
APM, Application Performance Monitoring System
Convert designs to code with AI
Introducing Visual Copilot: A new AI model to turn Figma designs to high quality code using your components.
Try Visual Copilot