 flowchart.js
Draws simple SVG flow chart diagrams from textual representation of the diagram
Top Related Projects

Generation of diagrams like flowcharts or sequence diagrams from text in a similar manner as markdown

draw.io is a JavaScript, client-side editor for general diagramming.

Generate diagrams from textual description

Virtual whiteboard for sketching hand-drawn like diagrams

Creates diagrams from textual descriptions!
Quick Overview
Flowchart.js is a JavaScript library that allows users to draw simple SVG flow charts through a domain-specific language. It provides an easy way to create and render flowcharts directly in the browser, making it useful for documentation, presentations, and interactive web applications.
Pros
- Simple and intuitive domain-specific language for defining flowcharts
- Generates SVG output, which is scalable and can be easily styled with CSS
- Supports various flowchart shapes and connectors
- Lightweight and easy to integrate into web projects
Cons
- Limited advanced features compared to more comprehensive diagramming tools
- May require additional styling for complex or professional-looking charts
- Documentation could be more extensive and up-to-date
- Not suitable for highly complex or specialized diagrams
Code Examples
- Creating a simple flowchart:
var chart = flowchart.parse(`
st=>start: Start
e=>end: End
op=>operation: My Operation
cond=>condition: Yes or No?

st->op->cond
cond(yes)->e
cond(no)->op`);

chart.drawSVG('diagram');
- Adding custom styles:
var chart = flowchart.parse('...');  // flowchart definition

chart.drawSVG('diagram', {
    'flowstate' : {
        'past' : { 'fill' : '#CCCCCC', 'font-size' : 12},
        'current' : {'fill' : '#008000', 'font-color' : 'white', 'font-weight' : 'bold'},
        'future' : { 'fill' : '#FFFF99'},
        'request' : { 'fill' : '#CCCCCC'}
    }
});
- Using custom symbols:
var chart = flowchart.parse(`
st=>start: Start|startCustomClass
e=>end: End|endCustomClass
op1=>operation: Operation 1|customClass
op2=>subroutine: Operation 2|customClass

st->op1->op2->e`);

chart.drawSVG('diagram');
Getting Started
- Include the flowchart.js library in your HTML:
<script src="https://cdnjs.cloudflare.com/ajax/libs/flowchart/1.17.1/flowchart.min.js"></script>
- Create a container for your flowchart:
<div id="diagram"></div>
- Define and draw your flowchart:
var chart = flowchart.parse(`
st=>start: Start
e=>end: End
op=>operation: My Operation

st->op->e`);

chart.drawSVG('diagram');
This will create a simple flowchart with a start node, an operation, and an end node.
Competitor Comparisons
Generation of diagrams like flowcharts or sequence diagrams from text in a similar manner as markdown
Pros of mermaid
- Supports a wider variety of diagram types (flowcharts, sequence diagrams, Gantt charts, etc.)
- More active development and larger community
- Better documentation and examples
Cons of mermaid
- Steeper learning curve due to more complex syntax
- Larger file size and potentially slower rendering for simple diagrams
Code Comparison
mermaid:
graph TD
    A[Start] --> B{Is it?}
    B -->|Yes| C[OK]
    B -->|No| D[End]
flowchart.js:
st=>start: Start
e=>end: End
op=>operation: My Operation
cond=>condition: Yes or No?

st->op->cond
cond(yes)->e
cond(no)->op
Both libraries allow for creating flowcharts, but mermaid's syntax is more concise and supports a wider range of diagram types. flowchart.js focuses specifically on flowcharts and uses a different syntax with explicit connections between nodes.
mermaid offers more flexibility and features, making it suitable for complex diagramming needs across various types. However, flowchart.js may be simpler to use for basic flowcharts and could have a gentler learning curve for newcomers to diagramming libraries.
The choice between the two depends on the specific requirements of your project, such as the types of diagrams needed, the complexity of the charts, and the desired level of customization.
draw.io is a JavaScript, client-side editor for general diagramming.
Pros of draw.io
- More comprehensive diagramming tool with support for various diagram types beyond flowcharts
- Rich set of features including real-time collaboration and integration with cloud storage services
- User-friendly interface with drag-and-drop functionality and extensive shape libraries
Cons of draw.io
- Larger codebase and more complex setup compared to flowchart.js
- May be overkill for simple flowchart needs, with a steeper learning curve
- Requires more resources to run, potentially impacting performance on low-end devices
Code Comparison
draw.io (JavaScript):
var graph = new mxGraph(container);
var parent = graph.getDefaultParent();
graph.getModel().beginUpdate();
try {
  var v1 = graph.insertVertex(parent, null, 'Hello', 20, 20, 80, 30);
  var v2 = graph.insertVertex(parent, null, 'World!', 200, 150, 80, 30);
  var e1 = graph.insertEdge(parent, null, '', v1, v2);
} finally {
  graph.getModel().endUpdate();
}
flowchart.js:
var chart = flowchart.parse('st=>start: Start\n' +
                            'e=>end: End\n' +
                            'op=>operation: My Operation\n' +
                            'cond=>condition: Yes or No?\n' +
                            'st->op->cond\n' +
                            'cond(yes)->e\n' +
                            'cond(no)->op');
chart.drawSVG('canvas');
Generate diagrams from textual description
Pros of PlantUML
- Supports a wide variety of diagram types beyond just flowcharts
- Text-based syntax allows for version control and easy collaboration
- Integrates well with various IDEs and documentation tools
Cons of PlantUML
- Steeper learning curve for its syntax compared to flowchart.js
- Requires Java runtime environment for local rendering
- Less customizable in terms of visual styling without advanced configuration
Code Comparison
PlantUML:
@startuml
start
:Step 1;
if (condition) then (yes)
  :Step 2;
else (no)
  :Step 3;
endif
:Step 4;
stop
@enduml
flowchart.js:
var chart = flowchart.parse(`
st=>start: Start
e=>end: End
op1=>operation: Step 1
cond=>condition: Condition?
op2=>operation: Step 2
op3=>operation: Step 3

st->op1->cond
cond(yes)->op2->e
cond(no)->op3->e
`);
chart.drawSVG('diagram');
Both libraries offer ways to create flowcharts, but PlantUML uses a more compact, text-based syntax while flowchart.js employs a JavaScript-based approach with a different syntax structure. PlantUML's versatility in diagram types is evident, while flowchart.js focuses specifically on flowcharts with a more accessible syntax for web developers.
Virtual whiteboard for sketching hand-drawn like diagrams
Pros of Excalidraw
- More feature-rich, offering a complete drawing and diagramming solution
- Provides a modern, intuitive user interface for creating diagrams
- Supports collaborative editing in real-time
Cons of Excalidraw
- Larger file size and potentially more complex to integrate
- May be overkill for simple flowchart needs
- Steeper learning curve for basic usage
Code Comparison
Flowchart.js:
var chart = flowchart.parse('st=>start: Start|past:>http://www.google.com[blank]\n' +
                            'e=>end: End:>http://www.google.com\n' +
                            'op1=>operation: My Operation|past\n' +
                            'op2=>operation: Stuff|current\n' +
                            'sub1=>subroutine: My Subroutine|invalid\n' +
                            'cond=>condition: Yes \n' +
                            'or No?|approved:>http://www.google.com\n' +
                            'c2=>condition: Good idea|rejected\n' +
                            'io=>inputoutput: catch something...|request\n');
chart.drawSVG('canvas');
Excalidraw:
import { exportToBlob } from "@excalidraw/excalidraw";

const blob = await exportToBlob({
  elements,
  appState,
  files,
  mimeType: "image/png",
});
While Flowchart.js focuses specifically on flowcharts with a simple API, Excalidraw offers a more comprehensive drawing solution with a different approach to integration and usage.
Creates diagrams from textual descriptions!
Pros of Kroki
- Supports multiple diagram types (flowcharts, sequence diagrams, etc.)
- Server-based rendering for consistent output across platforms
- Integrates with various documentation tools and frameworks
Cons of Kroki
- Requires server setup or use of a hosted service
- Potentially slower rendering due to server-side processing
- Less customization options for individual diagram types
Code Comparison
Flowchart.js:
var chart = flowchart.parse('st=>start: Start|past:>http://www.google.com[blank]\n' +
                            'e=>end: End:>http://www.google.com\n' +
                            'op1=>operation: My Operation|past\n' +
                            'op2=>operation: Stuff|current\n' +
                            'sub1=>subroutine: My Subroutine|invalid\n' +
                            'cond=>condition: Yes \nor No?|approved:>http://www.google.com\n' +
                            'io=>inputoutput: catch something...|request\n');
chart.drawSVG('canvas');
Kroki:
@startuml
Alice -> Bob: Authentication Request
Bob --> Alice: Authentication Response
Alice -> Bob: Another authentication Request
Alice <-- Bob: Another authentication Response
@enduml
Note: Kroki uses different syntax for each diagram type, while Flowchart.js focuses solely on flowcharts with its own specific syntax.
Convert  designs to code with AI

Introducing Visual Copilot: A new AI model to turn Figma designs to high quality code using your components.
Try Visual CopilotREADME
![]()
flowchart.js
flowchart.js is a flowchart DSL and SVG render that runs in the browser and terminal.
Nodes and connections are defined separately so that nodes can be reused and connections can be quickly changed. Fine grain changes to node and connection style can also be made right in the DSL.
Example
st=>start: Start:>http://www.google.com[blank]
e=>end:>http://www.google.com
getInfo=>input: Input Info
op1=>operation: My Operation
sub1=>subroutine: My Subroutine
cond=>condition: Yes
or No?:>http://www.google.com
io=>inputoutput: catch something...
printInfo=>output: Print info
para=>parallel: parallel tasks

st->getInfo->op1->cond
cond(yes)->io->printInfo->e
cond(no)->para
para(path1, bottom)->sub1(right)->op1
para(path2, top)->op1

CLI
See francoislaberge/diagrams on how to flowchart.js in the terminal.
Browser Usage
flowchart.js is on CDNJS, feel free to use it.
You will also need Raphaël, which is also on CDNJS.
The demo html page is at example/index.html.
Node Syntax
nodeName=>nodeType: nodeText[|flowstate][:>urlLink]
Items in [] are optional.
nodeName defines the nodes variable name within the flowchart document.
nodeType defines what type the node is. See Node Types for more information.
nodeText is the text that will be inserted into the node. Newlines are allowed and will be reflected in the rendered node text.
flowstate is optional and uses the | operator that specifies extra styling for the node.
urlLink is optional and uses the :> operator to specify the url to link to.
Node Types
Defines the shape that the node will take.
start
Used as the first node where flows start from.
Default text is Start.

st=>start: start
end
Used as the last node where a flow ends.
Default text is End.

e=>end: end
operation
Indicates that an operation needs to happen in the flow.

op1=>operation: operation
inputoutput
Indicates that IO happens in a flow.

io=>inputoutput: inputoutput
input
Indicates that Input happens in a flow.

getInfo=>input: Input info
output
Indicates that Output happens in a flow.

printInfo=>output: Print info
subroutine
Indicates that a subroutine happens in the flow and that there should be another flowchart that documents this subroutine.

sub1=>subroutine: subroutine
condition
Allows for a conditional or logical statement to direct the flow into one of two paths.

cond=>condition: condition
Yes or No?
parallel
Allows for multiple flows to happen simultaneously.

para=>parallel: parallel
Connections
Connections are defined in their own section below the node definitions.
The -> operator specifies a connection from one node to another like nodeVar1->nodeVar2->nodeVar3.
Not all nodes need to be specified in one string and can be separaged like so
nodeVar1->nodeVar2
nodeVar2->nodeVar3
Connection syntax is as follows:
<node variable name>[(<specification1>[, <specification2])]-><node variable name>[[(<specification1>[, <specification2])]-><node variable name>]
Items in [] are optional.
Directions
The following directions are available and define the direction the connection will leave the node from. If there are more than one specifiers, it is always the last. All nodes have a default direction making this an optional specification. <direction> will be used to indicate that one of the following should be used in its place.
- left
- right
- top
- bottom
Node Specific Specifiers by Type
Each node variables has optional specifiers, like direction, and some have special specifiers depending on the node type that are defined below. Specifiers are added after the variable name in () and separated with , like nodeVar(spec1, spec2).
start
Optional direction
startVar(<direction>)->nextNode
end
No specifications because connections only go to the end node and do not leave from it.
previousNode->endVar
operation
Optional direction
operationVar(<direction>)->nextNode
inputoutput
Optional direction
inputoutputVar(<direction>)->nextNode
subroutine
Optional direction
subroutineVar(<direction>)->nextNode
condition
Required logical specification of yes or no
Optional direction
conditionalVar(yes, <direction>)->nextNode1
conditionalVar(no,  <direction>)->nextNode2
parallel
Required path specification of path1, path2, or path3
Optional direction
parallelVar(path1, <direction>)->nextNode1
parallelVar(path2, <direction>)->nextNode2
parallelVar(path3, <direction>)->nextNode3
Links
A external link can be added to a node with the :> operator.
The st node is linked to http://www.google.com and will open a new tab because [blank] is at the end of the URL.
The e node is linked to http://www.yahoo.com and will cause the page to navigate to that page instead of opening a new tab.
st=>start: Start:>http://www.google.com[blank]
e=>end: End:>http://www.yahoo.com
Advice
Symbols that should possibly not be used in the text: => and -> and :> and | and @> and :$
If you want to emphasize a specific path in your flowchart, you can additionally define it like this:
st@>op1({"stroke":"Red"})@>cond({"stroke":"Red","stroke-width":6,"arrow-end":"classic-wide-long"})@>c2({"stroke":"Red"})@>op2({"stroke":"Red"})@>e({"stroke":"Red"})
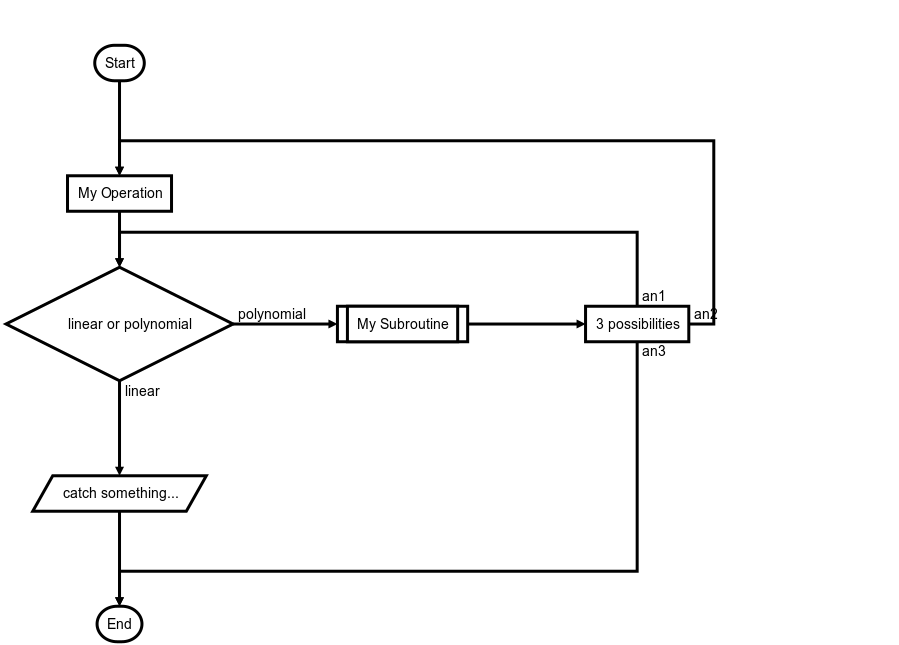
Custom names for branches
st=>start: Start:>http://www.google.com[blank]
e=>end:>http://www.google.com
op1=>operation: My Operation
sub1=>subroutine: My Subroutine
cond=>condition: linear or polynomial :>http://www.google.com
io=>inputoutput: catch something...
para=>parallel: 3 possibilities

st->op1->cond
cond(true@linear)->io->e
cond(false@polynomial)->sub1(right)
sub1(right)->para
para(path1@an1, top)->cond
para(path2@an2, right)->op1
para(path3@an3, bottom)->e
Demonstration
Contributors
via GitHub
Thanks
Many thanks to js-sequence-diagrams which greatly inspired this project, and forms the basis for the syntax.
Top Related Projects
Generation of diagrams like flowcharts or sequence diagrams from text in a similar manner as markdown
draw.io is a JavaScript, client-side editor for general diagramming.
Generate diagrams from textual description
Virtual whiteboard for sketching hand-drawn like diagrams
Creates diagrams from textual descriptions!
Convert designs to code with AI
Introducing Visual Copilot: A new AI model to turn Figma designs to high quality code using your components.
Try Visual Copilot