
Top Related Projects

Redefined chart library built with React and D3

Simple HTML5 Charts using the <canvas> tag

Bring data to life with SVG, Canvas and HTML. :bar_chart::chart_with_upwards_trend::tada:

Highcharts JS, the JavaScript charting framework
Quick Overview
React-ApexCharts is a React wrapper for ApexCharts, a modern charting library that helps developers create interactive and responsive charts. It provides a simple and declarative way to integrate ApexCharts into React applications, allowing for easy creation of various chart types with customizable options.
Pros
- Easy integration with React applications
- Wide variety of chart types and customization options
- Responsive and interactive charts out of the box
- Good documentation and community support
Cons
- Large bundle size due to the underlying ApexCharts library
- Limited server-side rendering support
- Learning curve for advanced customizations
- Occasional performance issues with large datasets
Code Examples
- Basic Line Chart:
import React from 'react';
import ReactApexChart from 'react-apexcharts';

const LineChart = () => {
  const options = {
    xaxis: {
      categories: ['Jan', 'Feb', 'Mar', 'Apr', 'May']
    }
  };
  const series = [{
    name: 'Sales',
    data: [30, 40, 35, 50, 49]
  }];

  return (
    <ReactApexChart type="line" options={options} series={series} height={350} />
  );
};
- Customized Bar Chart:
import React from 'react';
import ReactApexChart from 'react-apexcharts';

const BarChart = () => {
  const options = {
    chart: {
      type: 'bar'
    },
    plotOptions: {
      bar: {
        horizontal: true
      }
    },
    colors: ['#008FFB', '#00E396', '#FEB019']
  };
  const series = [{
    data: [400, 430, 448]
  }];

  return (
    <ReactApexChart options={options} series={series} type="bar" height={350} />
  );
};
- Responsive Pie Chart:
import React from 'react';
import ReactApexChart from 'react-apexcharts';

const PieChart = () => {
  const options = {
    labels: ['Team A', 'Team B', 'Team C'],
    responsive: [{
      breakpoint: 480,
      options: {
        chart: {
          width: 200
        },
        legend: {
          position: 'bottom'
        }
      }
    }]
  };
  const series = [44, 55, 13];

  return (
    <ReactApexChart options={options} series={series} type="pie" width={380} />
  );
};
Getting Started
To use React-ApexCharts in your project, follow these steps:
- Install the package:
npm install react-apexcharts apexcharts
- Import and use the component in your React application:
import React from 'react';
import ReactApexChart from 'react-apexcharts';

const MyChart = () => {
  const options = {
    // Chart options
  };
  const series = [
    // Chart data
  ];

  return (
    <ReactApexChart options={options} series={series} type="line" height={350} />
  );
};

export default MyChart;
Make sure to customize the options and series props according to your chart requirements. Refer to the ApexCharts documentation for detailed configuration options.
Competitor Comparisons
Redefined chart library built with React and D3
Pros of Recharts
- Built specifically for React, offering seamless integration and better performance
- Highly customizable with a declarative API, making it easier to create complex charts
- Smaller bundle size, which can lead to faster load times for applications
Cons of Recharts
- Less variety of chart types compared to ApexCharts
- Documentation can be less comprehensive, potentially leading to a steeper learning curve
- May require more custom code for advanced features that come built-in with ApexCharts
Code Comparison
Recharts:
import { LineChart, Line, XAxis, YAxis, CartesianGrid, Tooltip, Legend } from 'recharts';

<LineChart width={600} height={300} data={data}>
  <Line type="monotone" dataKey="value" stroke="#8884d8" />
  <CartesianGrid stroke="#ccc" />
  <XAxis dataKey="name" />
  <YAxis />
  <Tooltip />
</LineChart>
ApexCharts:
import Chart from 'react-apexcharts'

<Chart
  options={{
    chart: { id: 'basic-line' },
    xaxis: { categories: data.map(d => d.name) }
  }}
  series={[{ name: 'series-1', data: data.map(d => d.value) }]}
  type="line"
  width={600}
  height={300}
/>
Both libraries offer React-friendly APIs, but Recharts tends to be more declarative, while ApexCharts provides a more configuration-based approach.
Simple HTML5 Charts using the <canvas> tag
Pros of Chart.js
- Lightweight and fast, with a smaller bundle size
- Extensive documentation and large community support
- More flexible for custom chart types and animations
Cons of Chart.js
- Less out-of-the-box chart types compared to react-apexcharts
- Requires more manual configuration for advanced features
- Not specifically designed for React, may need additional wrappers
Code Comparison
Chart.js:
import { Chart } from 'chart.js/auto';

new Chart(ctx, {
    type: 'bar',
    data: chartData,
    options: chartOptions
});
react-apexcharts:
import ReactApexChart from 'react-apexcharts';

<ReactApexChart
    options={chartOptions}
    series={chartData}
    type="bar"
    height={350}
/>
Chart.js is a versatile and lightweight charting library that offers flexibility and extensive customization options. It has a larger community and more comprehensive documentation, making it easier to find solutions and examples. However, it requires more manual configuration for advanced features and isn't specifically designed for React applications.
react-apexcharts, on the other hand, is tailored for React and provides more out-of-the-box chart types and features. It offers a simpler API for React developers but may have a larger bundle size and less flexibility for highly custom chart types.
The choice between the two depends on specific project requirements, desired level of customization, and the developer's familiarity with React ecosystem.
Bring data to life with SVG, Canvas and HTML. :bar_chart::chart_with_upwards_trend::tada:
Pros of d3
- Highly flexible and customizable, allowing for complex and unique visualizations
- Extensive library with a wide range of chart types and data manipulation tools
- Large community and ecosystem with numerous extensions and resources
Cons of d3
- Steeper learning curve, requiring more time and effort to master
- More verbose code, often requiring more lines to create basic charts
- Less out-of-the-box responsiveness, requiring additional work for mobile-friendly designs
Code Comparison
d3:
const svg = d3.select("body").append("svg")
    .attr("width", 400)
    .attr("height", 300);

svg.selectAll("rect")
    .data(data)
    .enter()
    .append("rect")
    .attr("x", (d, i) => i * 70)
    .attr("y", (d, i) => 300 - 10 * d)
    .attr("width", 65)
    .attr("height", (d, i) => d * 10);
react-apexcharts:
<ReactApexChart
  options={{
    chart: { type: 'bar' },
    xaxis: { categories: ['A', 'B', 'C', 'D', 'E'] }
  }}
  series={[{ data: [30, 40, 35, 50, 49] }]}
  type="bar"
  height={350}
/>
Highcharts JS, the JavaScript charting framework
Pros of Highcharts
- More extensive chart types and features
- Better documentation and community support
- Robust export functionality for various formats
Cons of Highcharts
- Commercial license required for most use cases
- Steeper learning curve due to more complex API
- Larger file size, potentially impacting load times
Code Comparison
Highcharts:
Highcharts.chart('container', {
  chart: { type: 'line' },
  series: [{ data: [1, 2, 3, 4, 5] }]
});
React-ApexCharts:
<ApexCharts
  options={{ chart: { type: 'line' } }}
  series={[{ data: [1, 2, 3, 4, 5] }]}
/>
Summary
Highcharts offers a more comprehensive charting solution with extensive features and better documentation, but comes with a commercial license requirement and a steeper learning curve. React-ApexCharts, on the other hand, provides a simpler API and is free for commercial use, but may lack some advanced features found in Highcharts. The code comparison shows that both libraries have relatively straightforward implementations, with React-ApexCharts using a more React-friendly component approach.
Convert  designs to code with AI
Introducing Visual Copilot: A new AI model to turn Figma designs to high quality code using your components.
Try Visual CopilotREADME



React.js wrapper for ApexCharts to build interactive visualizations in react.
Download and Installation
Installing via npm
npm install react-apexcharts apexcharts
Usage
Client-Side Usage (Traditional)
import Chart from 'react-apexcharts'
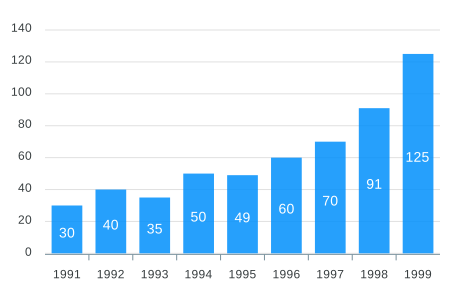
To create a basic bar chart with minimal configuration, write as follows:
class App extends Component {
  constructor(props) {
    super(props);

    this.state = {
      options: {
        chart: {
          id: 'apexchart-example'
        },
        xaxis: {
          categories: [1991, 1992, 1993, 1994, 1995, 1996, 1997, 1998, 1999]
        }
      },
      series: [{
        name: 'series-1',
        data: [30, 40, 35, 50, 49, 60, 70, 91, 125]
      }]
    }
  }
  render() {
    return (
      <Chart options={this.state.options} series={this.state.series} type="bar" width={500} height={320} />
    )
  }
}
This will render the following chart
How do I update the chart?
Simple! Just change the series or any option and it will automatically re-render the chart.
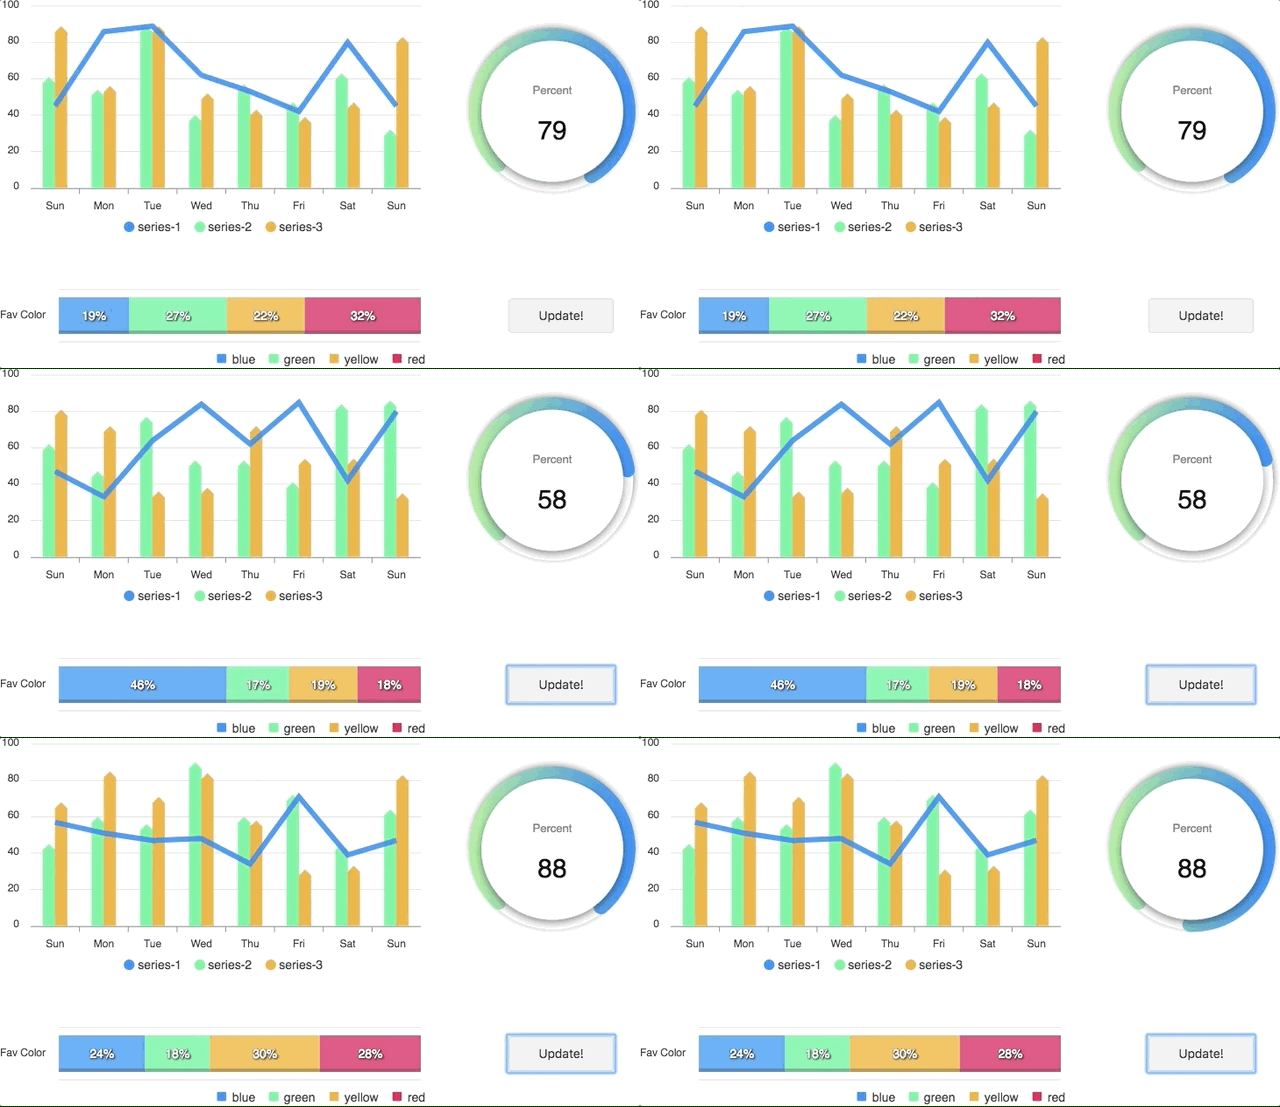
View this example on codesandbox
Server-Side Rendering (SSR) with Next.js App Router
New in v2.0.0: react-apexcharts now supports Server-Side Rendering with Next.js 13+ App Router using ApexCharts v5.5.0+.
Server Component (RSC)
Render charts on the server for faster initial page loads:
import Chart from 'react-apexcharts/server'

export default async function DashboardPage() {
  const series = [{
    name: 'series-1',
    data: [30, 40, 35, 50, 49, 60, 70, 91, 125]
  }]

  const options = {
    chart: { id: 'apexchart-example' },
    xaxis: { categories: [1991, 1992, 1993, 1994, 1995, 1996, 1997, 1998, 1999] }
  }

  return (
    <Chart
      type="bar"
      series={series}
      options={options}
      width={500}
      height={320}
    />
  )
}
With Client-Side Hydration
For interactive charts, combine server rendering with client-side hydration:
// app/dashboard/page.tsx (Server Component)
import Chart from 'react-apexcharts/server'
import ChartHydrate from './ChartHydrate'

export default async function DashboardPage() {
  const series = [{ data: [30, 40, 35, 50, 49, 60, 70] }]
  const options = { chart: { type: 'bar' }, xaxis: { categories: ['A', 'B', 'C', 'D', 'E', 'F', 'G'] } }

  return (
    <div>
      <Chart type="bar" series={series} options={options} width={500} height={300} />
      <ChartHydrate />
    </div>
  )
}
// app/dashboard/ChartHydrate.tsx (Client Component)
'use client'
import Hydrate from 'react-apexcharts/hydrate'

export default function ChartHydrate() {
  return (
    <Hydrate
      className="my-chart"
      clientOptions={{
        chart: {
          animations: {
            enabled: true,
            speed: 800
          }
        }
      }}
    />
  )
}
Client-Only Usage in Next.js
For client-only rendering (same as before):
'use client'
import Chart from 'react-apexcharts'

export default function ClientChart() {
  const options = {
    chart: { id: 'apexchart-example' },
    xaxis: { categories: [1991, 1992, 1993, 1994, 1995, 1996, 1997, 1998, 1999] }
  }

  const series = [{
    name: 'series-1',
    data: [30, 40, 35, 50, 49, 60, 70, 91, 125]
  }]

  return <Chart type="bar" series={series} options={options} />
}
Important: While updating the options, make sure to update the outermost property even when you need to update the nested property.
â Do this
this.setState({
  options: {
    ...this.state.options,
    xaxis: {
      ...this.state.options.xaxis,
      categories: ['X1', 'X2', 'X3']
    }
  }
})
â Not this
this.setState({
  options.xaxis.categories: ['X1', 'X2', 'X3']
})
Tree-Shaking (Smaller Bundles)
New in v2.1.0: Use the /core export to reduce your bundle size by only importing the chart types and features you actually use. This requires apexcharts >=5.10.1.
// Instead of:
import Chart from 'react-apexcharts'

// Use the core variant:
import Chart from 'react-apexcharts/core'

// Then manually register only what you need:
import 'apexcharts/bar'                  // bar / column chart type
import 'apexcharts/line'                 // line / area / scatter chart type
import 'apexcharts/features/legend'      // legend feature
import 'apexcharts/features/annotations' // annotations feature
// ... etc.
Full example:
import Chart from 'react-apexcharts/core'
import 'apexcharts/bar'
import 'apexcharts/features/legend'

export default function BarChart() {
  const series = [{ name: 'Sales', data: [30, 40, 35, 50, 49, 60, 70, 91, 125] }]
  const options = {
    chart: { id: 'bar-chart' },
    xaxis: { categories: [1991, 1992, 1993, 1994, 1995, 1996, 1997, 1998, 1999] }
  }

  return <Chart type="bar" series={series} options={options} width={500} height={320} />
}
The core variant also has SSR and hydration counterparts:
import Chart from 'react-apexcharts/core/server'   // Server Component (async)
import Hydrate from 'react-apexcharts/core/hydrate' // Client hydration
Note for Vite users: Add
resolve: { dedupe: ['apexcharts'] }to yourvite.config.jsto prevent Vite from loading two separate ApexCharts instances when mixing imports.
Props
| Prop | Type | Description |
|---|---|---|
| series | Array | The series is a set of data. To know more about the format of the data, checkout Series docs on the website. |
| type | String | line, area, bar, pie, donut, scatter, bubble, heatmap, radialBar |
| width | Number or String | Possible values for width can be 100%, 400px or 400 (by default is 100%) |
| height | Number or String | Possible values for height can be 100%, 300px or 300 (by default is auto) |
| options | Object | The configuration object, see options on API (Reference) |
| chartRef | React.RefObject | Pass a ref to get access to the underlying ApexCharts instance for imperative API calls |
How to call methods of ApexCharts programmatically?
Sometimes, you may want to call other methods of the core ApexCharts library, and you can do so on ApexCharts global variable directly
Example
ApexCharts.exec('reactchart-example', 'updateSeries', [{
  data: [40, 55, 65, 11, 23, 44, 54, 33]
}])
More info on the .exec() method can be found here
All other methods of ApexCharts can be called this way
What's included
The published package includes the following files.
react-apexcharts/
âââ dist/
â âââ react-apexcharts.cjs.js # CommonJS (default import)
â âââ react-apexcharts.esm.js # ES Module (default import)
â âââ react-apexcharts.iife.min.js # IIFE for browser <script> tags
â âââ react-apexcharts.min.js # CommonJS (backward compat alias)
â âââ react-apexcharts-server.esm.js # react-apexcharts/server
â âââ react-apexcharts-hydrate.esm.js # react-apexcharts/hydrate
â âââ react-apexcharts-core.cjs.js # react-apexcharts/core (CJS)
â âââ react-apexcharts-core.esm.js # react-apexcharts/core (ESM)
â âââ react-apexcharts-core-server.esm.js # react-apexcharts/core/server
â âââ react-apexcharts-core-hydrate.esm.js # react-apexcharts/core/hydrate
âââ types/
âââ react-apexcharts.d.ts
âââ react-apexcharts-server.d.ts
âââ react-apexcharts-hydrate.d.ts
âââ react-apexcharts-core.d.ts
âââ react-apexcharts-core-server.d.ts
âââ react-apexcharts-core-hydrate.d.ts
Development
Install dependencies
npm install
Running the example
Basic example including update is included to show how to get started using ApexCharts with React easily.
To run the examples,
cd example
npm install
npm run start
Bundling
To build
npm run build
License
ApexCharts is offered under a dual-license model to support individuals, startups, and commercial products of all sizes. Read full license agreements here: https://apexcharts.com/license
Top Related Projects
Redefined chart library built with React and D3
Simple HTML5 Charts using the <canvas> tag
Bring data to life with SVG, Canvas and HTML. :bar_chart::chart_with_upwards_trend::tada:
Highcharts JS, the JavaScript charting framework
Convert designs to code with AI
Introducing Visual Copilot: A new AI model to turn Figma designs to high quality code using your components.
Try Visual Copilot