
Top Related Projects

draw.io is a JavaScript, client-side editor for general diagramming.

🚀 JavaScript diagramming library that uses SVG and HTML for rendering.

Graph theory (network) library for visualisation and analysis

Visual connectivity for webapps

Directed graph layout for JavaScript
Quick Overview
JointJS is a powerful diagramming and visualization library for creating interactive diagrams, flowcharts, and other graphical representations in web applications. It provides a rich set of tools and features for building complex, interactive diagrams with ease.
Pros
- Highly customizable and extensible
- Supports various diagram types (flowcharts, state machines, ER diagrams, etc.)
- Excellent documentation and examples
- Active development and community support
Cons
- Steep learning curve for advanced features
- Large file size, which may impact performance in some applications
- Limited built-in themes and styles
- Requires additional plugins for some advanced functionalities
Code Examples
- Creating a basic shape:
const graph = new joint.dia.Graph();
const paper = new joint.dia.Paper({
    el: document.getElementById('myholder'),
    model: graph,
    width: 600,
    height: 400,
    gridSize: 1
});

const rect = new joint.shapes.standard.Rectangle();
rect.position(100, 30);
rect.resize(100, 40);
rect.attr({
    body: {
        fill: 'blue'
    },
    label: {
        text: 'Hello',
        fill: 'white'
    }
});

rect.addTo(graph);
- Creating a link between two shapes:
const rect1 = new joint.shapes.standard.Rectangle();
rect1.position(100, 30);
rect1.resize(100, 40);
rect1.attr('label/text', 'Shape 1');

const rect2 = new joint.shapes.standard.Rectangle();
rect2.position(300, 30);
rect2.resize(100, 40);
rect2.attr('label/text', 'Shape 2');

const link = new joint.shapes.standard.Link();
link.source(rect1);
link.target(rect2);

graph.addCells([rect1, rect2, link]);
- Adding interactivity to shapes:
rect.on('change:position', function(element) {
    console.log('Element moved to:', element.get('position'));
});

paper.on('element:pointerclick', function(elementView) {
    elementView.model.attr('body/fill', 'red');
});
Getting Started
-
Install JointJS via npm:
npm install jointjs -
Include JointJS in your HTML:
<script src="node_modules/jointjs/dist/joint.js"></script> <link rel="stylesheet" type="text/css" href="node_modules/jointjs/dist/joint.css" /> -
Create a container for your diagram:
<div id="myholder"></div> -
Initialize JointJS in your JavaScript:
const graph = new joint.dia.Graph(); const paper = new joint.dia.Paper({ el: document.getElementById('myholder'), model: graph, width: 600, height: 400, gridSize: 1 }); -
Start creating your diagram by adding shapes and links to the graph.
Competitor Comparisons
draw.io is a JavaScript, client-side editor for general diagramming.
Pros of draw.io
- More comprehensive diagramming tool with a wider range of diagram types and features
- Offers both web-based and desktop applications for greater flexibility
- Larger community and more extensive documentation
Cons of draw.io
- Steeper learning curve due to its extensive feature set
- Heavier and potentially slower for simpler diagramming needs
- Less customizable for developers looking to integrate diagramming into their applications
Code Comparison
draw.io (JavaScript):
var graph = new mxGraph(container);
var parent = graph.getDefaultParent();
graph.getModel().beginUpdate();
try {
  var v1 = graph.insertVertex(parent, null, 'Hello,', 20, 20, 80, 30);
  var v2 = graph.insertVertex(parent, null, 'World!', 200, 150, 80, 30);
  var e1 = graph.insertEdge(parent, null, '', v1, v2);
} finally {
  graph.getModel().endUpdate();
}
JointJS (JavaScript):
var graph = new joint.dia.Graph;
var paper = new joint.dia.Paper({
  el: document.getElementById('paper'),
  model: graph,
  width: 600,
  height: 400,
  gridSize: 1
});
var rect = new joint.shapes.standard.Rectangle();
rect.position(100, 30);
rect.resize(100, 40);
rect.attr({
  body: { fill: 'blue' },
  label: { text: 'Hello', fill: 'white' }
});
rect.addTo(graph);
🚀 JavaScript diagramming library that uses SVG and HTML for rendering.
Pros of X6
- More extensive and customizable graph editing features
- Better performance for large-scale diagrams
- Active development with frequent updates and new features
Cons of X6
- Steeper learning curve due to more complex API
- Less mature documentation compared to JointJS
- Smaller community and fewer third-party extensions
Code Comparison
X6:
import { Graph } from '@antv/x6';

const graph = new Graph({
  container: document.getElementById('container'),
  width: 800,
  height: 600,
});

graph.addNode({
  x: 100,
  y: 100,
  width: 80,
  height: 40,
  label: 'Hello',
});
JointJS:
var graph = new joint.dia.Graph();
var paper = new joint.dia.Paper({
  el: document.getElementById('paper'),
  model: graph,
  width: 800,
  height: 600,
});

var rect = new joint.shapes.standard.Rectangle();
rect.position(100, 100);
rect.resize(80, 40);
rect.attr('label/text', 'Hello');
rect.addTo(graph);
Both libraries offer powerful graph and diagramming capabilities, but X6 provides more advanced features and better performance for complex diagrams. JointJS has a gentler learning curve and more mature documentation. The code examples show that X6 has a more concise API for creating and adding nodes, while JointJS requires separate steps for creating, positioning, and adding shapes to the graph.
Graph theory (network) library for visualisation and analysis
Pros of Cytoscape.js
- More specialized for graph theory and network analysis
- Extensive documentation and active community support
- Wider range of built-in graph algorithms and analysis tools
Cons of Cytoscape.js
- Less flexible for general-purpose diagramming
- Steeper learning curve for non-graph-specific visualizations
- Limited out-of-the-box support for interactive diagram editing
Code Comparison
JointJS example:
var graph = new joint.dia.Graph;
var paper = new joint.dia.Paper({
    el: $('#paper'),
    width: 600,
    height: 400,
    model: graph
});
Cytoscape.js example:
var cy = cytoscape({
    container: document.getElementById('cy'),
    elements: [
        { data: { id: 'a' } },
        { data: { id: 'b' } },
        { data: { id: 'ab', source: 'a', target: 'b' } }
    ]
});
Both libraries offer ways to create and manipulate graph structures, but Cytoscape.js is more focused on graph theory and network analysis, while JointJS provides a more general-purpose diagramming solution. Cytoscape.js excels in complex graph visualizations and analysis, while JointJS offers greater flexibility for various types of diagrams and interactive editing.
Visual connectivity for webapps
Pros of jsPlumb
- More lightweight and focused specifically on connecting elements
- Easier to get started with for simple diagramming needs
- Better documentation and examples for beginners
Cons of jsPlumb
- Less feature-rich compared to JointJS for complex diagramming
- Limited built-in shape and element types
- Less suitable for large-scale, data-intensive diagrams
Code Comparison
JointJS example:
var graph = new joint.dia.Graph;
var paper = new joint.dia.Paper({
    el: $('#paper'),
    width: 600,
    height: 200,
    model: graph
});

var rect = new joint.shapes.basic.Rect({
    position: { x: 100, y: 30 },
    size: { width: 100, height: 30 },
    attrs: { rect: { fill: 'blue' }, text: { text: 'my box', fill: 'white' } }
});

graph.addCell(rect);
jsPlumb example:
jsPlumb.ready(function() {
    var instance = jsPlumb.getInstance();
    instance.connect({
        source: "element1",
        target: "element2",
        anchor: ["Left", "Right"],
        endpoint: "Dot"
    });
});
Both libraries offer ways to create diagrams and connect elements, but JointJS provides a more comprehensive framework for building complex diagrams, while jsPlumb focuses on simpler connection-based diagrams. JointJS uses a graph model, while jsPlumb directly manipulates DOM elements. Choose based on your project's complexity and specific requirements.
Directed graph layout for JavaScript
Pros of dagre
- Specialized in directed graph layouts, offering efficient algorithms for complex graph structures
- Lightweight and focused on graph layout, making it easier to integrate into existing projects
- Provides more customization options for fine-tuning graph layouts
Cons of dagre
- Limited to graph layout functionality, lacking built-in interactive features
- Requires additional libraries or custom code for rendering and user interactions
- Less comprehensive documentation and examples compared to Joint
Code Comparison
Joint example:
var graph = new joint.dia.Graph;
var paper = new joint.dia.Paper({
    el: $('#paper'),
    width: 600,
    height: 400,
    model: graph
});
dagre example:
var g = new dagre.graphlib.Graph();
g.setGraph({});
g.setDefaultEdgeLabel(function() { return {}; });
g.setNode("a", { label: "A" });
g.setNode("b", { label: "B" });
Joint provides a more comprehensive solution for creating interactive diagrams, while dagre focuses specifically on graph layout algorithms. Joint offers a higher-level API for creating and manipulating diagram elements, whereas dagre requires additional work to render and interact with the generated layout. The choice between the two depends on the specific requirements of the project and the level of customization needed for graph layouts.
Convert  designs to code with AI
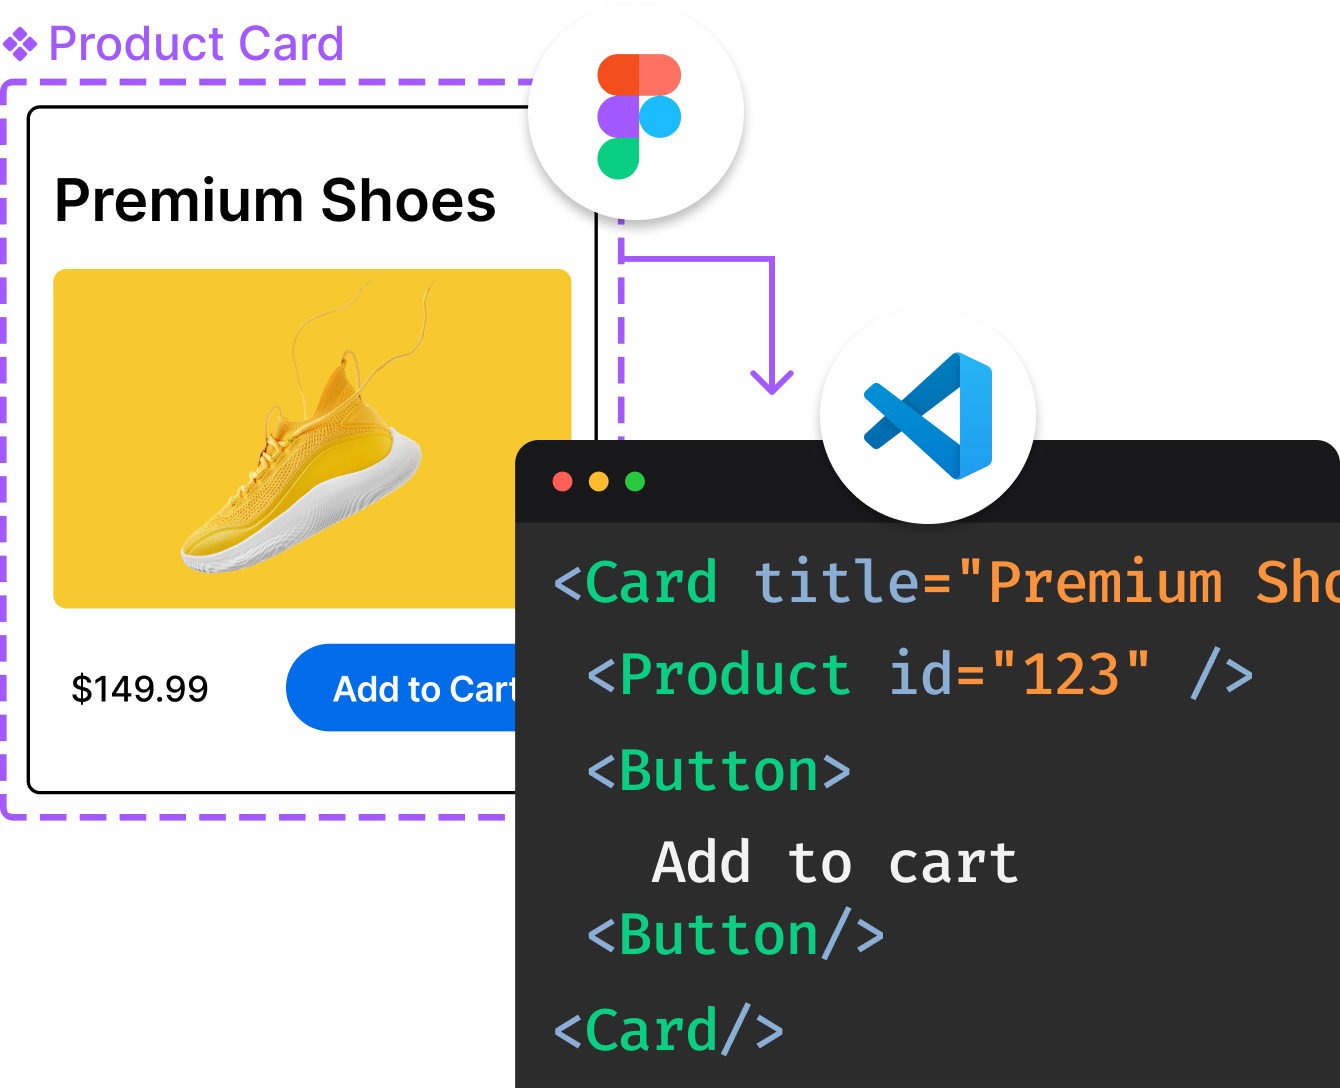
Introducing Visual Copilot: A new AI model to turn Figma designs to high quality code using your components.
Try Visual CopilotREADME
JointJS â The JavaScript diagramming library you don't replace at scale
JointJS is a proven JavaScript/TypeScript diagramming library for building complex, production-scale diagramming applications.
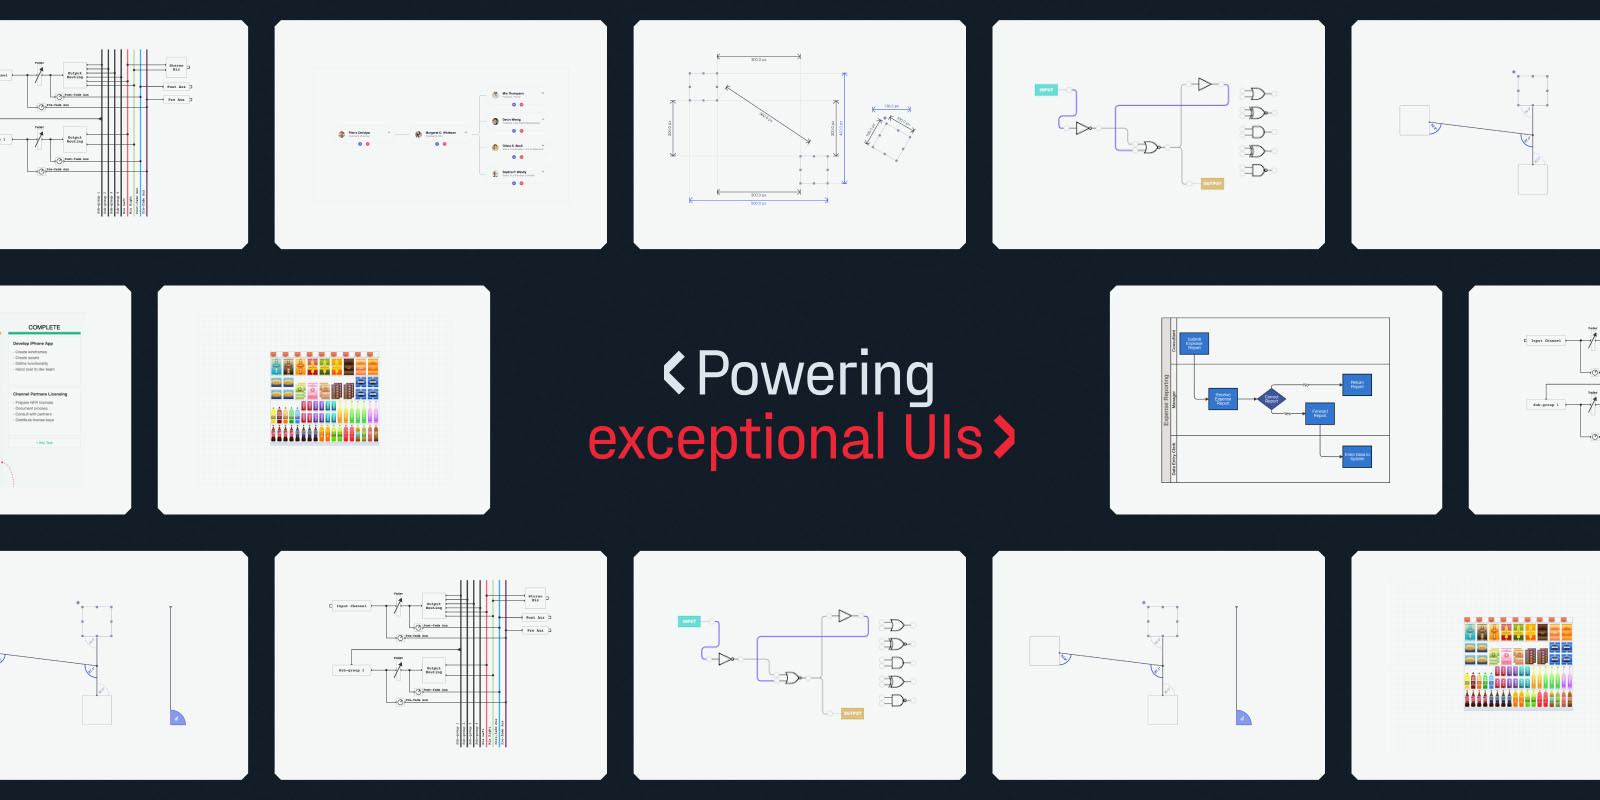
Teams use it to build AI workflow builders, flowchart and process editors, BPMN modelers, SCADA/HMI and monitoring dashboards, data modeling tools, energy network diagrams, electronic design tools, and org chart builders.
JointJS is framework-agnostic, with first-class support for React.
Further information, examples and documentation can be found at jointjs.com.
- ð Getting started guide
- ð¡ Ask a question or share feedback in our GitHub discussions
- ðï¸ 180+ demo apps to kickstart your development
- ð¤ MCP server integration for AI coding agents
- âï¸ New: JointJS for React â build diagramming UIs in your React app
Use cases
JointJS is used to build production diagramming applications across many domains:
| Domain | Examples |
|---|---|
| Workflow & process | Flowchart editors, process automation, activity and sequence diagrams |
| AI workflow builders | Node-based AI pipeline and agent builders, marketing automation studios |
| BPMN | Business process modelers, swimlanes, Visio BPMN import/export |
| Data modeling | ER diagrams, database schema designers, data mapping tools |
| UML & software modeling | Class, sequence, statechart and use-case diagrams |
| Industrial / SCADA & HMI | P&ID diagrams, monitoring and control dashboards |
| Energy networks | Power and telecom network diagrams, DWDM circuits |
| Electronic design | Logic circuits, wiring and cable diagrams |
| Org charts | Organizational charts, hierarchy and tree builders |
| Timelines | Project and milestone timelines, Gantt and PERT charts |
Explore all 180+ demo apps that serve as boilerplates for your project.
Framework integrations
JointJS is framework-agnostic and works with any frontend stack. React has first-class, native support; the others have integration guides and examples:
- React â native components and hooks (JointJS for React)
- Angular
- Vue
- Svelte
- Salesforce Lightning
Features
- essential diagram elements (rect, circle, ellipse, text, image, path)
- ready-to-use diagram elements of well-known diagrams (ERD, Org chart, FSA, UML, PN, DEVS, ...)
- custom diagram elements based on SVG or programmatically rendered
- connecting diagram elements with links or links with links
- customizable links, their arrowheads and labels
- configurable link shapes (anchors, connection points, vertices, routers, connectors)
- custom element properties and data
- import/export from/to JSON format
- customizable element ports (look and position, distributed around shapes or manually positioned)
- rich graph API (traversal, dfs, bfs, find neighbors, predecessors, elements at point, ...)
- granular interactivity
- hierarchical diagrams (containers, embedded elements, child-parent relationships)
- element & link tools (buttons, status icons, tools to change the shape of links, ...)
- highlighters (provide visual emphasis to your elements)
- automatic layouts (arrange the elements and links automatically)
- highly event driven (react on any event that happens inside the diagram)
- zoom in/out
- touch support
- MVC architecture
- SVG based
- ... a lot more
Using JointJS with AI coding agents
JointJS is built to work well with AI-assisted development.
MCP server â connect your AI coding agent (Claude Code, Cursor, and other MCP-compatible tools) to the JointJS Model Context Protocol server so it can search the official docs and demos while you build.
https://mcp.jointjs.com/mcp
Exposes search_docs and search_demos so your agent writes correct JointJS code against the real API instead of guessing.
Supported browsers
- Latest Google Chrome (including mobile)
- Latest Firefox
- Latest Safari (including mobile)
- Latest Microsoft's Edge
- Latest Opera
Commercial version
The open-source library covers core diagramming. JointJS+ adds production-ready plugins (stencils, inspectors, toolbars, advanced layouts, import/export, and more), professional demo apps (including source code), JointJS for React, and direct support from the team that builds the library. Start a free 30-day trial.
Development Environment
If you want to work on JointJS locally, use the following guidelines to get started.
Dependencies
Make sure you have the following dependencies installed on your system:
The installation requires Node version 22.14.0, to avoid syntax errors during installation.
Make sure that you are using Yarn version >= 2.0.0, so that you have access to Yarn workspace ranges functionality. If you are using Volta, it will automatically read this restriction from package.json.
Setup
Clone this git repository:
git clone https://github.com/clientIO/joint.git
Navigate to the joint directory:
cd joint
Install all dependencies:
yarn install
Generate distribution files from the source code:
yarn run dist
You are now ready to browse our example applications, which combine functionality from multiple JointJS packages:
cd examples
Refer to each application's README.md file for additional instructions.
You can also browse the demo applications of our JointJS Core package:
cd packages/joint-core/demo
Most demos can be run by simply opening the index.html file in your browser. Some demos have additional instructions, which you can find in their respective README.md files.
Tests
To run all tests:
yarn run test
To run only the server-side tests:
yarn run test-server
To run only the client-side tests:
yarn run test-client
To run only TypeScript tests:
yarn run test-ts
Lint
To check for linting errors in src and types directories:
yarn run lint
To auto fix errors, run eslint for src and types directories:
yarn run lint-fix
Code Coverage Reports
To output a code coverage report in HTML:
yarn run test-coverage
To output a code coverage report in lcov format:
yarn run test-coverage-lcov
The output for all unit tests will be saved in the packages/joint-core/coverage directory.
Contributors
License
The JointJS library is licensed under the Mozilla Public License 2.0.
Copyright © 2013-2026 client IO
Top Related Projects
draw.io is a JavaScript, client-side editor for general diagramming.
🚀 JavaScript diagramming library that uses SVG and HTML for rendering.
Graph theory (network) library for visualisation and analysis
Visual connectivity for webapps
Directed graph layout for JavaScript
Convert designs to code with AI
Introducing Visual Copilot: A new AI model to turn Figma designs to high quality code using your components.
Try Visual Copilot