 pyroscope
Continuous Profiling Platform. Debug performance issues down to a single line of code
Top Related Projects

Vector is an on-host performance monitoring framework which exposes hand picked high resolution metrics to every engineer’s browser.

Agent for collecting, processing, aggregating, and writing metrics, logs, and other arbitrary data.

Prometheus instrumentation library for Python applications
Quick Overview
Pyroscope is an open-source continuous profiling platform. It helps developers find performance issues and bottlenecks in their applications by providing always-on, low-overhead profiling capabilities. Pyroscope supports multiple programming languages and integrates with various observability tools.
Pros
- Low-overhead profiling with minimal impact on application performance
- Support for multiple programming languages (Go, Python, Ruby, Java, and more)
- Easy integration with existing observability stacks (Grafana, Prometheus, etc.)
- Powerful visualization and analysis tools for identifying performance bottlenecks
Cons
- Relatively new project, still evolving and may have some stability issues
- Limited documentation compared to more established profiling tools
- Requires additional setup and infrastructure to run effectively
- May have a learning curve for teams not familiar with continuous profiling concepts
Code Examples
- Instrumenting a Go application:
package main

import (
    "github.com/pyroscope-io/client/pyroscope"
)

func main() {
    pyroscope.Start(pyroscope.Config{
        ApplicationName: "my.go.app",
        ServerAddress:   "http://pyroscope-server:4040",
    })

    // Your application code here
}
- Profiling a Python application:
from pyroscope import configure

configure(
    application_name="my.python.app",
    server_address="http://pyroscope-server:4040",
)

# Your application code here
- Instrumenting a Ruby application:
require 'pyroscope'

Pyroscope.configure do |config|
  config.application_name = "my.ruby.app"
  config.server_address = "http://pyroscope-server:4040"
end

# Your application code here
Getting Started
To start using Pyroscope:
-
Install the Pyroscope server:
docker run -it -p 4040:4040 pyroscope/pyroscope:latest server -
Install the appropriate client library for your language:
# For Go go get github.com/pyroscope-io/client/pyroscope # For Python pip install pyroscope-io # For Ruby gem install pyroscope -
Instrument your application using the code examples provided above.
-
Access the Pyroscope UI at
http://localhost:4040to view and analyze profiling data.
Competitor Comparisons
Vector is an on-host performance monitoring framework which exposes hand picked high resolution metrics to every engineer’s browser.
Pros of Vector
- Designed for high-performance, real-time metrics collection and processing
- Supports a wide range of input and output plugins for versatile data handling
- Offers advanced features like data transformation and aggregation
Cons of Vector
- Steeper learning curve due to its extensive configuration options
- May require more system resources for complex setups
- Less focused on continuous profiling compared to Pyroscope
Code Comparison
Vector configuration example:
[sources.cpu_metrics]
  type = "host_metrics"
  collectors = ["cpu"]

[sinks.prometheus]
  type = "prometheus"
  inputs = ["cpu_metrics"]
Pyroscope configuration example:
scrape_configs:
  - job_name: 'python'
    static_configs:
      - targets: ['localhost:4040']
    profiling_config:
      pprof_config:
        python:
          path: "/debug/pprof/profile"
Vector focuses on metrics collection and processing, while Pyroscope specializes in continuous profiling. Vector's configuration is more versatile, allowing for various data sources and sinks. Pyroscope's configuration is tailored for profiling specific applications and services. Both tools serve different primary purposes but can complement each other in a comprehensive observability stack.
Agent for collecting, processing, aggregating, and writing metrics, logs, and other arbitrary data.
Pros of Telegraf
- Broader data collection capabilities, supporting a wide range of input plugins for various systems and services
- More mature project with a larger community and extensive documentation
- Native integration with InfluxDB and other time-series databases
Cons of Telegraf
- Steeper learning curve due to its extensive configuration options
- Higher resource consumption, especially when collecting data from multiple sources
- Less focused on continuous profiling compared to Pyroscope
Code Comparison
Telegraf configuration (telegraf.conf):
[[inputs.cpu]]
  percpu = true
  totalcpu = true
  collect_cpu_time = false
  report_active = false
Pyroscope configuration (pyroscope.yml):
server:
  storage:
    path: /tmp/pyroscope
  api-server:
    listen-addr: :4040
Both projects use configuration files, but Telegraf's configuration is more extensive due to its broader scope. Pyroscope's configuration is simpler and more focused on profiling-specific settings.
Telegraf is a versatile metrics collection agent suitable for various monitoring scenarios, while Pyroscope specializes in continuous profiling. Choose Telegraf for comprehensive system monitoring and Pyroscope for in-depth application performance profiling.
Prometheus instrumentation library for Python applications
Pros of client_python
- Well-established and widely adopted in the Prometheus ecosystem
- Supports a broad range of Prometheus metrics types (Counter, Gauge, Histogram, Summary)
- Extensive documentation and community support
Cons of client_python
- Focused solely on metrics collection, lacking profiling capabilities
- May require additional setup for visualization and alerting
Code Comparison
client_python:
from prometheus_client import Counter
c = Counter('my_failures', 'Description of counter')
c.inc()     # Increment by 1
c.inc(1.6)  # Increment by given value
Pyroscope:
import pyroscope
pyroscope.configure(application_name="my_app")

@pyroscope.tag("my_function")
def my_function():
    # Function code here
Summary
While client_python excels in metrics collection for Prometheus, Pyroscope focuses on continuous profiling. client_python offers a wider range of metric types and is deeply integrated with the Prometheus ecosystem. However, Pyroscope provides built-in profiling capabilities, which can be valuable for performance analysis. The choice between the two depends on whether the primary need is for metrics collection or continuous profiling.
Convert  designs to code with AI
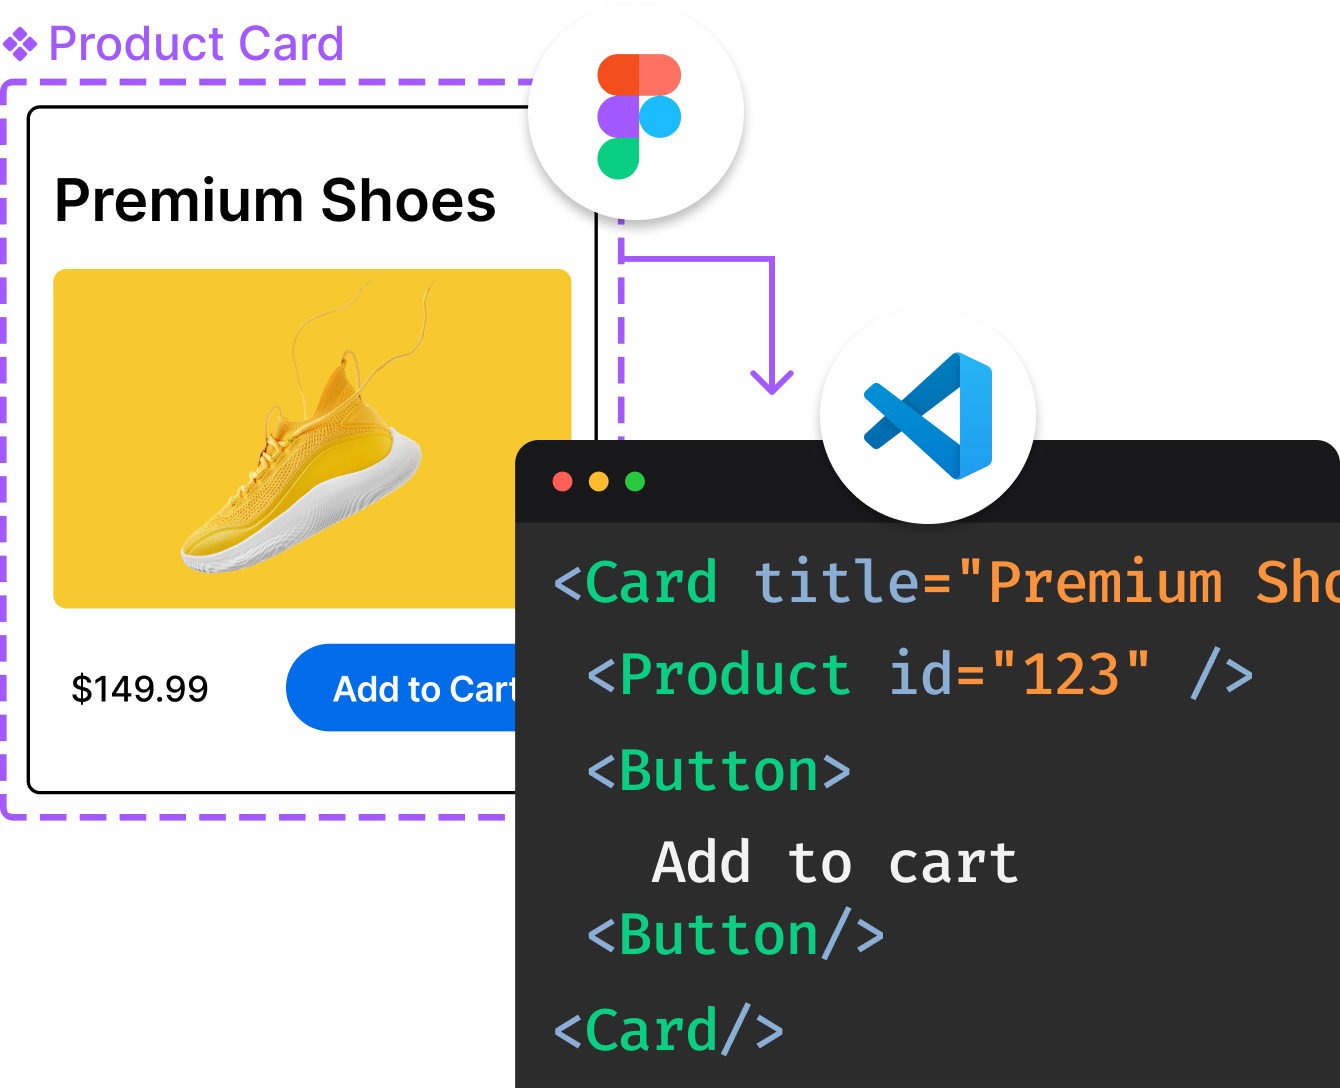
Introducing Visual Copilot: A new AI model to turn Figma designs to high quality code using your components.
Try Visual CopilotREADME






ð Announcement: Pyroscope 2.0 is here!
Pyroscope 2.0 makes the new v2 architecture the default. Profiles are written directly to object storage, removing the need for in-memory ingesters and local disks - simplifying operations and lowering resource usage at scale. Existing v1 deployments can opt in via a flag and migrate without data loss.
Read the 2.0 release notes and the v2 architecture overview. Upgrading from v1? See the migration guide.
Want the full story? Watch the GrafanaCON 2026 talk Pyroscope 2.0: Continuous Profiling Architecture Deep Dive.
What is Grafana Pyroscope?
Grafana Pyroscope is a continuous profiling platform designed to surface performance insights from your applications, helping you optimize resource usage such as CPU, memory, and I/O operations. With Pyroscope, you can both proactively and reactively address performance bottlenecks across your system.
The typical use cases are:
- Proactive: Reducing resource consumption, improving application performance, or preventing latency issues.
- Reactive: Quickly resolving incidents with line-level detail and debugging active CPU, memory, or I/O bottlenecks.
Pyroscope provides powerful tools to give you a comprehensive view of your application's behavior while allowing you to drill down into specific services for more targeted root cause analysis.
How Does Pyroscope Work?

Pyroscope consists of three main components:
- Pyroscope Server: Stores and processes profiling data and serves queries.
- Clients and instrumentation: Profiling data reaches the server in several ways: the Pyroscope SDKs (push), Grafana Alloy (pull or push), or OTLP from OpenTelemetry-compatible sources such as the OpenTelemetry eBPF profiler.
- Grafana Profiles Drilldown: A queryless, intuitive UI for visualizing and analyzing profiling data (formerly Explore Profiles).
Under the hood, Pyroscope v2 writes profiles straight to object storageâno ingesters, no local disk. The animations below trace the three parts of the architecture. For the details behind each component, see the v2 architecture documentation.
Write path â profiles are routed by service and written straight to object storage:

Compaction â compaction-workers merge small segments into larger blocks in the background:

Read path â queries fan out across object storage to build flame graphs in Grafana Profiles Drilldown:

Pyroscope Live Demo
Quick Start: Run the Pyroscope server locally
Docker
docker run -it -p 4040:4040 grafana/pyroscope
Homebrew (macOS / Linux)
brew install pyroscope-io/brew/pyroscope
brew services start pyroscope
Binary
Download the archive for your operating system and architecture from the latest release, unpack it, and run the binary:
tar xvf pyroscope_*.tar.gz
./pyroscope
Pyroscope listens on port 4040. For Kubernetes/Helm, Linux packages, building from source, and full configuration options, see the Get started guide and the server documentation.
Quick Start: Visualize profiles with Grafana Profiles Drilldown
Grafana Profiles Drilldown (formerly Explore Profiles) is the primary, queryless way to visualize and analyze your profiling data.
Grafana Cloud / OSS
Profiles Drilldown is pre-installed and is the default way to explore your profiles â all you need to do is start sending data.
Documentation
For more information on how to use Pyroscope with other programming languages, install it on Linux, or use it in a production environment, check out our documentation:
Send data to the server
You can send profiles to Pyroscope with the language SDKs, with Grafana Alloy, or over OTLP from OpenTelemetry-compatible sources such as the OpenTelemetry eBPF profiler.
For more documentation on how to add the Pyroscope SDK to your code, see the client documentation on our website or find language-specific examples and documentation below:


Supported Languages
Our documentation contains the most recent list of supported languages and also an overview over what profiling types are supported per language.
Let us know what other integrations you want to see in our issues or in our slack.
Credits
Pyroscope is possible thanks to the excellent work of many people, including but not limited to:
- Brendan Gregg â inventor of Flame Graphs
- Julia Evans â creator of rbspy â sampling profiler for Ruby
- Vladimir Agafonkin â creator of flamebearer â fast flame graph renderer
- Ben Frederickson â creator of py-spy â sampling profiler for Python
- Adam Saponara â creator of phpspy â sampling profiler for PHP
- Alexei Starovoitov, Daniel Borkmann, and many others who made BPF based profiling in Linux kernel possible
- Jamie Wong â creator of speedscope â interactive flame graph visualizer
Contributing
To start contributing, check out our Contributing Guide
Thanks to the contributors of Pyroscope!






















Top Related Projects
Vector is an on-host performance monitoring framework which exposes hand picked high resolution metrics to every engineer’s browser.
Agent for collecting, processing, aggregating, and writing metrics, logs, and other arbitrary data.
Prometheus instrumentation library for Python applications
Convert designs to code with AI
Introducing Visual Copilot: A new AI model to turn Figma designs to high quality code using your components.
Try Visual Copilot