
Top Related Projects

Chaos testing, network emulation, and stress testing tool for containers

Monitoring, visualisation & management for Docker & Kubernetes

eBPF-based Networking, Security, and Observability

eBPF-powered network observability for Kubernetes. Indexes L4/L7 traffic with full K8s context, decrypts TLS without keys. Queryable by AI agents via MCP and humans via dashboard.
API traffic analyzer for Kubernetes, providing deep packet inspection with complete API and Kubernetes contexts, retaining cluster-wide L4 traffic (PCAP), and using minimal production compute resources.

Old repo for Linkerd 1.x. See the linkerd2 repo for Linkerd 2.x.
Quick Overview
The nicolaka/netshoot repository is a collection of network debugging tools and utilities packaged in a Docker container. It provides a convenient way to troubleshoot and analyze network issues without the need to install various tools on the host system.
Pros
- Portability: The Docker container can be easily deployed and used on any system with Docker installed, making it platform-independent.
- Comprehensive Tools: The repository includes a wide range of network debugging tools, such as
tcpdump,ngrep,dig,curl, andnetcat, among others. - Easy to Use: The container can be quickly launched with a single Docker command, providing a self-contained environment for network analysis.
- Reproducibility: The Docker image ensures a consistent and reproducible environment for network troubleshooting, making it easier to share and collaborate on network issues.
Cons
- Requires Docker: Users must have Docker installed on their system to take advantage of the
nicolaka/netshootcontainer, which may not be suitable for all environments. - Limited to Container Networking: The tools within the container are limited to analyzing network traffic within the container itself, and may not provide a complete view of the overall network.
- Potential Performance Impact: Running network debugging tools within a container may have a slight performance impact compared to running them directly on the host system.
- Dependency on Docker Image Updates: Users are dependent on the maintainers of the
nicolaka/netshootDocker image to keep the tools up-to-date and secure.
Getting Started
To use the nicolaka/netshoot container, follow these steps:
-
Ensure you have Docker installed on your system.
-
Pull the latest
nicolaka/netshootDocker image:docker pull nicolaka/netshoot -
Launch the container with the desired network interface and options:
docker run -it --rm --network host nicolaka/netshootThis command will start the container in interactive mode, attach it to the host network, and remove the container when you exit.
-
Once inside the container, you can use the various network debugging tools as needed. For example, to capture network traffic using
tcpdump:tcpdump -i eth0 -nThis will start capturing network traffic on the
eth0interface and display the packets in a human-readable format. -
Explore the other tools available in the container, such as
ngrep,dig,curl, andnetcat, to diagnose and troubleshoot network issues.
Remember, the nicolaka/netshoot container is a self-contained environment, so any changes or data within the container will not persist beyond the container's lifetime. Use it as a temporary tool for network analysis and debugging.
Competitor Comparisons
Chaos testing, network emulation, and stress testing tool for containers
Pros of Pumba
- Focused on chaos testing and network emulation for Docker containers
- Provides a CLI tool for easy integration into CI/CD pipelines
- Supports advanced network emulation scenarios like packet loss and latency
Cons of Pumba
- Limited to Docker environments, not as versatile for general networking tasks
- Requires more setup and configuration compared to Netshoot's ready-to-use container
- Less comprehensive set of networking tools for general troubleshooting
Code Comparison
Netshoot usage:
docker run -it --net container:<container_name> nicolaka/netshoot
Pumba usage:
pumba netem --duration 5m delay --time 3000 re2:^web
Summary
Netshoot is a versatile networking troubleshooting toolkit container, while Pumba focuses on chaos testing and network emulation for Docker environments. Netshoot offers a wide range of pre-installed networking tools, making it ideal for quick diagnostics and general-purpose networking tasks. Pumba, on the other hand, excels in creating controlled chaos scenarios and network disruptions for testing container resilience.
Netshoot is more user-friendly for ad-hoc troubleshooting, whereas Pumba is better suited for automated testing and CI/CD integration. The choice between the two depends on the specific use case: general networking diagnostics (Netshoot) or targeted chaos testing in Docker environments (Pumba).
Monitoring, visualisation & management for Docker & Kubernetes
Pros of Scope
- Provides a comprehensive visualization of container networks and applications
- Offers real-time monitoring and troubleshooting capabilities
- Integrates well with Kubernetes and other container orchestration platforms
Cons of Scope
- Requires more setup and resources to run compared to Netshoot
- May be overkill for simple network diagnostics tasks
- Has a steeper learning curve for users new to container networking
Code Comparison
Netshoot usage:
docker run -it --net container:<container_name> nicolaka/netshoot
Scope usage:
scope launch
Summary
Netshoot is a lightweight, container-based network troubleshooting toolkit, while Scope is a more comprehensive monitoring and visualization tool for container environments. Netshoot excels in quick, targeted diagnostics, whereas Scope provides a broader view of network topology and application performance. The choice between the two depends on the specific needs of the user and the complexity of the environment being monitored or troubleshooted.
eBPF-based Networking, Security, and Observability
Pros of Cilium
- Comprehensive network security and observability solution for cloud-native environments
- Advanced eBPF-based networking, security, and visibility features
- Scalable and performant for large Kubernetes clusters
Cons of Cilium
- Steeper learning curve due to its complexity and advanced features
- Requires more resources and setup compared to lightweight tools
- May be overkill for simple networking diagnostics tasks
Code Comparison
Netshoot (Dockerfile excerpt):
FROM alpine:latest
RUN apk update && apk add --no-cache \
    bash tcpdump curl iperf3 mtr nmap
Cilium (Helm chart values example):
cilium:
  enabled: true
  hubble:
    enabled: true
  nodePort:
    enabled: true
  kubeProxyReplacement: strict
Summary
Netshoot is a lightweight, container-based networking troubleshooting toolkit, while Cilium is a full-featured, eBPF-powered networking solution for Kubernetes. Netshoot excels in quick diagnostics and debugging, whereas Cilium provides comprehensive network security, observability, and advanced features for cloud-native environments. Choose Netshoot for simple troubleshooting tasks and Cilium for robust, scalable networking in complex Kubernetes deployments.
eBPF-powered network observability for Kubernetes. Indexes L4/L7 traffic with full K8s context, decrypts TLS without keys. Queryable by AI agents via MCP and humans via dashboard.
Pros of Kubeshark
- Specialized for Kubernetes environments, offering deep insights into cluster traffic
- Provides a user-friendly web interface for real-time traffic analysis
- Supports protocol-aware API traffic inspection for various services
Cons of Kubeshark
- More complex setup and resource-intensive compared to Netshoot
- Limited to Kubernetes environments, less versatile for general networking tasks
- Steeper learning curve for users not familiar with Kubernetes concepts
Code Comparison
Netshoot usage:
docker run -it --net container:<container_name> nicolaka/netshoot
Kubeshark usage:
kubeshark tap
Key Differences
Netshoot is a lightweight, versatile networking troubleshooting toolkit that can be used in various container environments. It's ideal for quick diagnostics and general-purpose networking tasks.
Kubeshark, on the other hand, is a specialized tool for Kubernetes environments, offering deep packet inspection and API-level traffic analysis. It provides a more comprehensive view of cluster communications but requires more resources and setup.
While Netshoot is better suited for quick, ad-hoc troubleshooting across different container platforms, Kubeshark excels in providing detailed, continuous monitoring and analysis specifically for Kubernetes clusters.
API traffic analyzer for Kubernetes, providing deep packet inspection with complete API and Kubernetes contexts, retaining cluster-wide L4 traffic (PCAP), and using minimal production compute resources.
Pros of Kubeshark
- Specialized for Kubernetes environments, offering deep insights into cluster traffic
- Provides a user-friendly web interface for real-time traffic analysis
- Supports protocol-aware API traffic inspection for various services
Cons of Kubeshark
- More complex setup and resource-intensive compared to Netshoot
- Limited to Kubernetes environments, less versatile for general networking tasks
- Steeper learning curve for users not familiar with Kubernetes concepts
Code Comparison
Netshoot usage:
docker run -it --net container:<container_name> nicolaka/netshoot
Kubeshark usage:
kubeshark tap
Key Differences
Netshoot is a lightweight, versatile networking troubleshooting toolkit that can be used in various container environments. It's ideal for quick diagnostics and general-purpose networking tasks.
Kubeshark, on the other hand, is a specialized tool for Kubernetes environments, offering deep packet inspection and API-level traffic analysis. It provides a more comprehensive view of cluster communications but requires more resources and setup.
While Netshoot is better suited for quick, ad-hoc troubleshooting across different container platforms, Kubeshark excels in providing detailed, continuous monitoring and analysis specifically for Kubernetes clusters.
Old repo for Linkerd 1.x. See the linkerd2 repo for Linkerd 2.x.
Pros of Linkerd
- Full-featured service mesh for Kubernetes with advanced traffic management
- Provides automatic mTLS, observability, and load balancing
- Lightweight and easy to install with minimal configuration
Cons of Linkerd
- More complex setup and learning curve compared to Netshoot
- Focused on Kubernetes environments, less versatile for general networking tasks
- Requires cluster-wide installation and management
Code Comparison
Linkerd (Kubernetes deployment):
apiVersion: apps/v1
kind: Deployment
metadata:
  name: my-app
  annotations:
    linkerd.io/inject: enabled
Netshoot (Docker run command):
docker run -it --net container:<container_name> nicolaka/netshoot
Summary
Linkerd is a comprehensive service mesh solution for Kubernetes, offering advanced networking features and observability. Netshoot, on the other hand, is a versatile networking troubleshooting toolkit that can be used in various environments.
Linkerd excels in managing complex microservices architectures, providing automatic security and observability. However, it has a steeper learning curve and is primarily designed for Kubernetes.
Netshoot is more flexible and easier to use for general networking diagnostics across different platforms. It's ideal for quick troubleshooting but lacks the advanced features of a full service mesh.
Choose Linkerd for comprehensive Kubernetes networking management, or Netshoot for versatile, on-demand networking diagnostics and troubleshooting.
Convert  designs to code with AI
Introducing Visual Copilot: A new AI model to turn Figma designs to high quality code using your components.
Try Visual CopilotREADME
netshoot: a Docker + Kubernetes network trouble-shooting swiss-army container
                    dP            dP                           dP
                    88            88                           88
88d888b. .d8888b. d8888P .d8888b. 88d888b. .d8888b. .d8888b. d8888P
88'  `88 88ooood8   88   Y8ooooo. 88'  `88 88'  `88 88'  `88   88
88    88 88.  ...   88         88 88    88 88.  .88 88.  .88   88
dP    dP `88888P'   dP   `88888P' dP    dP `88888P' `88888P'   dP
Purpose: Docker and Kubernetes network troubleshooting can become complex. With proper understanding of how Docker and Kubernetes networking works and the right set of tools, you can troubleshoot and resolve these networking issues. The netshoot container has a set of powerful networking troubleshooting tools that can be used to troubleshoot Docker networking issues. Along with these tools come a set of use-cases that show how this container can be used in real-world scenarios.
Network Namespaces: Before starting to use this tool, it's important to go over one key topic: Network Namespaces. Network namespaces provide isolation of the system resources associated with networking. Docker uses network and other type of namespaces (pid,mount,user..etc) to create an isolated environment for each container. Everything from interfaces, routes, and IPs is completely isolated within the network namespace of the container.
Kubernetes also uses network namespaces. Kubelets creates a network namespace per pod where all containers in that pod share that same network namespace (eths,IP, tcp sockets...etc). This is a key difference between Docker containers and Kubernetes pods.
Cool thing about namespaces is that you can switch between them. You can enter a different container's network namespace, perform some troubleshooting on its network's stack with tools that aren't even installed on that container. Additionally, netshoot can be used to troubleshoot the host itself by using the host's network namespace. This allows you to perform any troubleshooting without installing any new packages directly on the host or your application's package.
Netshoot with Docker
-
Container's Network Namespace: If you're having networking issues with your application's container, you can launch
netshootwith that container's network namespace like this:$ docker run -it --net container:<container_name> nicolaka/netshoot -
Host's Network Namespace: If you think the networking issue is on the host itself, you can launch
netshootwith that host's network namespace:$ docker run -it --net host nicolaka/netshoot -
Network's Network Namespace: If you want to troubleshoot a Docker network, you can enter the network's namespace using
nsenter. This is explained in thensentersection below.
Netshoot with Docker Compose
You can easily deploy netshoot using Docker Compose using something like this:
version: "3.6"
services:
  tcpdump:
    image: nicolaka/netshoot
    depends_on:
      - nginx
    command: tcpdump -i eth0 -w /data/nginx.pcap
    network_mode: service:nginx
    volumes:
      - $PWD/data:/data

  nginx:
    image: nginx:alpine
    ports:
      - 80:80
Netshoot with Kubernetes
-
if you want to debug using an ephemeral container in an existing pod:
$ kubectl debug mypod -it --image=nicolaka/netshoot -
if you want to spin up a throw away pod for debugging.
$ kubectl run tmp-shell --rm -i --tty --image nicolaka/netshoot -
if you want to spin up a container on the host's network namespace.
$ kubectl run tmp-shell --rm -i --tty --overrides='{"spec": {"hostNetwork": true}}' --image nicolaka/netshoot -
if you want to use netshoot as a sidecar container to troubleshoot your application container
# netshoot-sidecar.yaml
---
apiVersion: apps/v1
kind: Deployment
metadata:
 name: nginx-netshoot
 labels:
   app: nginx-netshoot
spec:
 replicas: 1
 selector:
   matchLabels:
     app: nginx-netshoot
 template:
   metadata:
     labels:
       app: nginx-netshoot
   spec:
     containers:
       - name: nginx
         image: nginx:1.14.2
         ports:
           - containerPort: 80
       - name: netshoot
         image: nicolaka/netshoot
         command: ["/bin/bash"]
         args: ["-c", "while true; do ping localhost; sleep 60;done"]
$ kubectl apply -f netshoot-sidecar.yaml
deployment.apps/nginx-netshoot created

$ kubectl get pod
NAME                              READY   STATUS    RESTARTS   AGE
nginx-netshoot-7f9c6957f8-kr8q6   2/2     Running   0          4m27s

$ kubectl exec -it nginx-netshoot-7f9c6957f8-kr8q6 -c netshoot -- /bin/zsh
                   dP            dP                           dP
                   88            88                           88
88d888b. .d8888b. d8888P .d8888b. 88d888b. .d8888b. .d8888b. d8888P
88'  `88 88ooood8   88   Y8ooooo. 88'  `88 88'  `88 88'  `88   88
88    88 88.  ...   88         88 88    88 88.  .88 88.  .88   88
dP    dP `88888P'   dP   `88888P' dP    dP `88888P' `88888P'   dP

Welcome to Netshoot! (github.com/nicolaka/netshoot)

nginx-netshoot-7f9c6957f8-kr8q6 $
The netshoot kubectl plugin
To easily troubleshoot networking issues in your k8s environment, you can leverage the Netshoot Kubectl Plugin (shout out to Nebojsa Ilic for creating it!). Using this kubectl plugin, you can easily create ephemeral netshoot containers to troubleshoot existing pods, k8s controller or worker nodes. To install the plugin, follow these steps.
Sample Usage:
# spin up a throwaway pod for troubleshooting
kubectl netshoot run tmp-shell

# debug using an ephemeral container in an existing pod
kubectl netshoot debug my-existing-pod

# create a debug session on a node
kubectl netshoot debug node/my-node
Network Problems
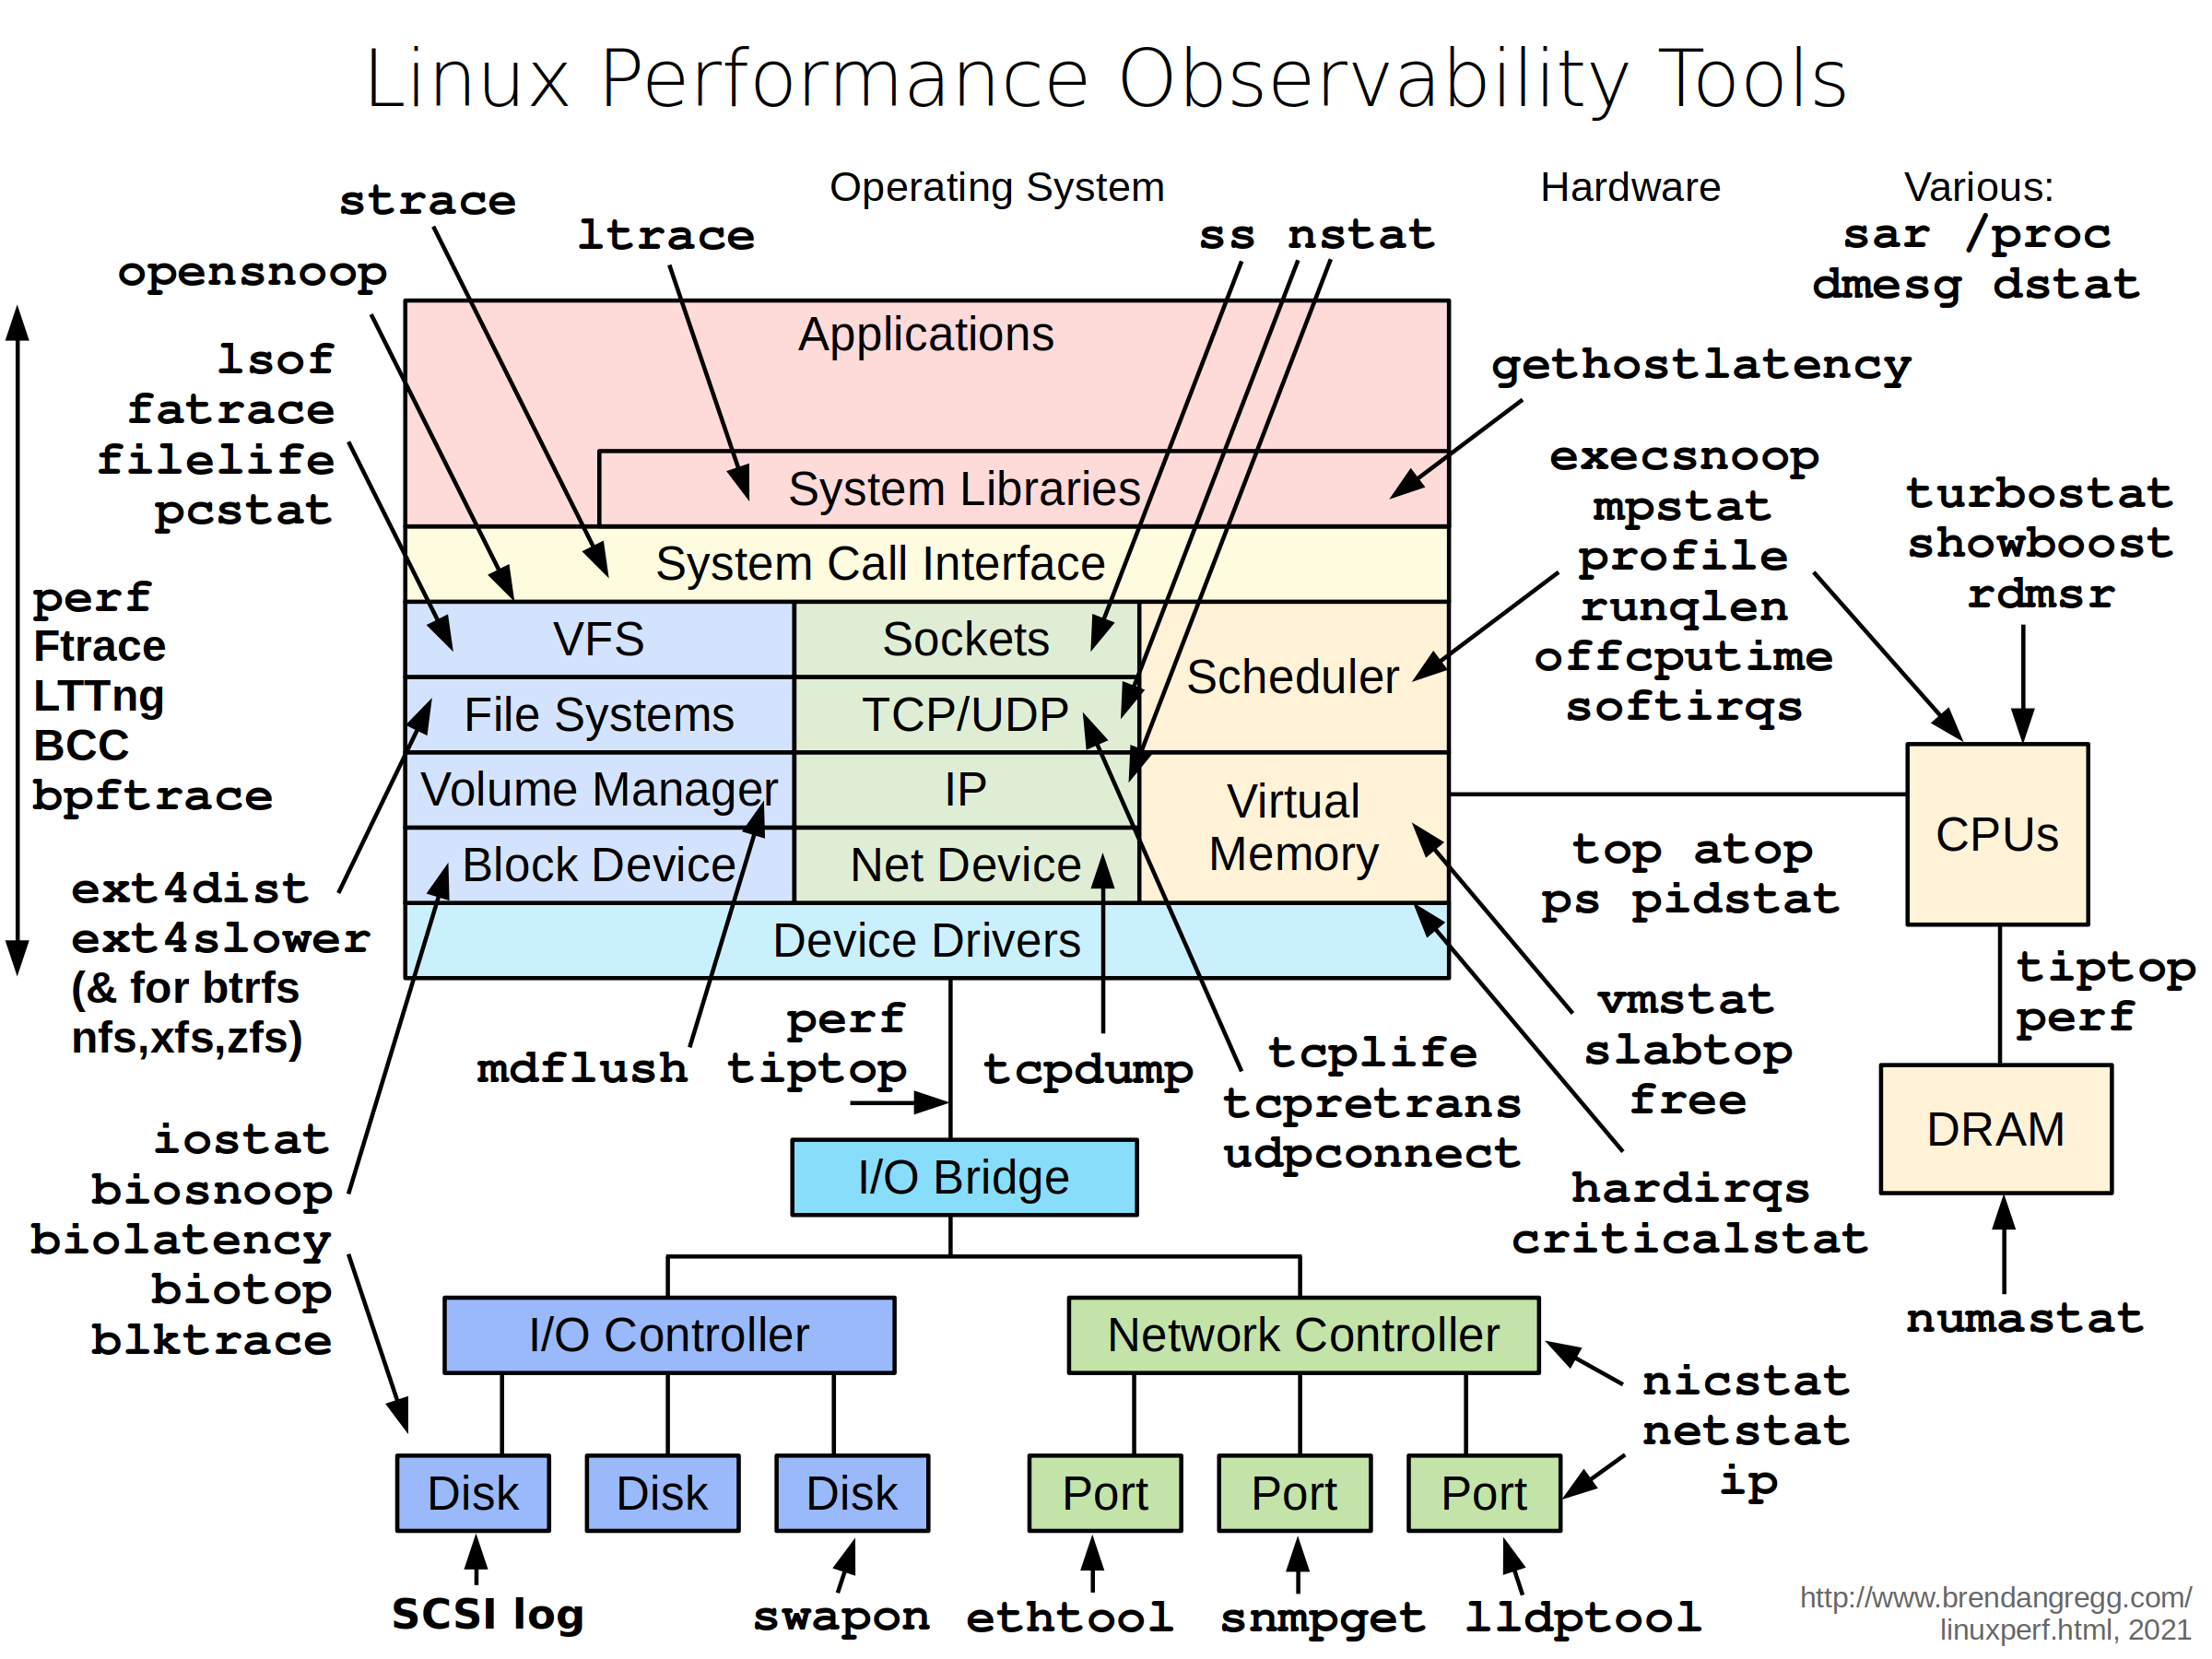
Many network issues could result in application performance degradation. Some of those issues could be related to the underlying networking infrastructure(underlay). Others could be related to misconfiguration at the host or Docker level. Let's take a look at common networking issues:
- latency
- routing
- DNS resolution
- firewall
- incomplete ARPs
To troubleshoot these issues, netshoot includes a set of powerful tools as recommended by this diagram.
Included Packages: The following packages and binaries are included in netshoot:
apache2-utils \
bash \
bind-tools \
bird \
bridge-utils \
busybox-extras \
conntrack-tools \
curl \
dhcping \
drill \
ethtool \
file \
fping \
iftop \
iperf \
iperf3 \
iproute2 \
ipset \
iptables \
iptraf-ng \
iputils \
ipvsadm \
httpie \
jq \
libc6-compat \
liboping \
ltrace \
mtr \
net-snmp-tools \
netcat-openbsd \
nftables \
ngrep \
nmap \
nmap-nping \
nmap-scripts \
openssl \
py3-pip \
py3-setuptools \
scapy \
socat \
speedtest-cli \
openssh \
oh-my-zsh \
strace \
tcpdump \
tcptraceroute \
trippy \
tshark \
util-linux \
vim \
git \
zsh \
websocat \
swaks \
perl-crypt-ssleay \
perl-net-ssleay
Additionally, the following binaries are included:
ctop
calicoctl
termshark
grpcurl
fortio
Sample Use-cases
iperf
Purpose: test networking performance between two containers/hosts.
Example:
$ docker network create -d bridge perf-test
$ docker run -d --rm --net perf-test --name perf-test-a nicolaka/netshoot iperf -s -p 9999
$ docker run -it --rm --net perf-test --name perf-test-b nicolaka/netshoot iperf -c perf-test-a -p 9999
tcpdump
tcpdump is a powerful and common packet analyzer that runs under the command line. It allows the user to display TCP/IP and other packets being transmitted or received over an attached network interface.
$ docker run -it --net container:perf-test-a nicolaka/netshoot
/ # tcpdump -i eth0 port 9999 -c 1 -Xvv
netstat
Purpose: netstat is a useful tool for checking your network configuration and activity.
$ docker run -it --net container:perf-test-a nicolaka/netshoot
/ # netstat -tulpn
nmap
nmap ("Network Mapper") is an open source tool for network exploration and security auditing. It is very useful for scanning to see which ports are open between a given set of hosts.
$ docker run -it --privileged nicolaka/netshoot nmap -p 12376-12390 -dd 172.31.24.25
iftop
Purpose: iftop does for network usage what top does for CPU usage. It listens to network traffic on a named interface and displays a table of current bandwidth usage by pairs of hosts.
$ docker run -it --net container:perf-test-a nicolaka/netshoot iftop -i eth0
drill
Purpose: drill is a tool to designed to get all sorts of information out of the DNS.
$ docker run -it --net container:perf-test-a nicolaka/netshoot drill -V 5 perf-test-b
netcat
Purpose: a simple Unix utility that reads and writes data across network connections, using the TCP or UDP protocol. It's useful for testing and troubleshooting TCP/UDP connections. netcat can be used to detect if there's a firewall rule blocking certain ports.
$ docker network create -d bridge my-br
$ docker run -d --rm --net my-br --name service-a nicolaka/netshoot nc -l 8080
$ docker run -it --rm --net my-br --name service-b nicolaka/netshoot nc -vz service-a 8080
iproute2
Purpose: a collection of utilities for controlling TCP / IP networking and traffic control in Linux.
$ docker run -it --net host nicolaka/netshoot
/ # ip route show
/ # ip neigh show
nsenter
Purpose: nsenter is a powerful tool allowing you to enter into any namespaces. nsenter is available inside netshoot but requires netshoot to be run as a privileged container. Additionally, you may want to mount the /var/run/docker/netns directory to be able to enter any network namespace including bridge networks.
$ docker run -it --rm -v /var/run/docker/netns:/var/run/docker/netns --privileged=true nicolaka/netshoot
/ # cd /var/run/docker/netns/
/var/run/docker/netns # ls
/ # nsenter --net=/var/run/docker/netns/<namespace> sh
CTOP
ctop is a free open source, simple and cross-platform top-like command-line tool for monitoring container metrics in real-time. It allows you to get an overview of metrics concerning CPU, memory, network, I/O for multiple containers and also supports inspection of a specific container.
$ docker run -it --rm -v /var/run/docker.sock:/var/run/docker.sock nicolaka/netshoot ctop
Termshark
Termshark is a terminal user-interface for tshark. It allows user to read pcap files or sniff live interfaces with Wireshark's display filters.
$ docker run --rm --cap-add=NET_ADMIN --cap-add=NET_RAW -it nicolaka/netshoot termshark -i eth0 icmp
$ docker run --rm --cap-add=NET_ADMIN --cap-add=NET_RAW -v /tmp/ipv4frags.pcap:/tmp/ipv4frags.pcap -it nicolaka/netshoot termshark -r /tmp/ipv4frags.pcap
Swaks
Swaks (Swiss Army Knife for SMTP) is a featureful, flexible, scriptable, transaction-oriented SMTP test tool. It is free to use and licensed under the GNU GPLv2.
swaks --to user@example.com \
  --from fred@example.com --h-From: '"Fred Example" <fred@example.com>' \
  --auth CRAM-MD5 --auth-user me@example.com \
  --header-X-Test "test email" \
  --tls \
  --data "Example body"
Grpcurl
grpcurl is a command-line tool that lets you interact with gRPC servers. It's basically curl for gRPC servers.
grpcurl grpc.server.com:443 my.custom.server.Service/Method
# no TLS
grpcurl -plaintext grpc.server.com:80 my.custom.server.Service/Method
Fortio
Fortio is a fast, small, reusable, embeddable go library as well as a command line tool and server process, the server includes a simple web UI and REST API to trigger run and see graphical representation of the results.
$ fortio load http://www.google.com
Contribution
Feel free to contribute networking troubleshooting tools and use-cases by opening PRs. If you would like to add any package, please follow these steps:
- In the PR, please include some rationale as to why this tool is useful to be included in netshoot.
Note: If the functionality of the tool is already addressed by an existing tool, I might not accept the PR
- Change the Dockerfile to include the new package/tool
- If you're building the tool from source, make sure you leverage the multi-stage build process and update the
build/fetch_binaries.shscript - Update the README's list of included packages AND include a section on how to use the tool
- If the tool you're adding supports multi-platform, please make sure you highlight that.
Top Related Projects
Chaos testing, network emulation, and stress testing tool for containers
Monitoring, visualisation & management for Docker & Kubernetes
eBPF-based Networking, Security, and Observability
eBPF-powered network observability for Kubernetes. Indexes L4/L7 traffic with full K8s context, decrypts TLS without keys. Queryable by AI agents via MCP and humans via dashboard.
API traffic analyzer for Kubernetes, providing deep packet inspection with complete API and Kubernetes contexts, retaining cluster-wide L4 traffic (PCAP), and using minimal production compute resources.
Old repo for Linkerd 1.x. See the linkerd2 repo for Linkerd 2.x.
Convert designs to code with AI
Introducing Visual Copilot: A new AI model to turn Figma designs to high quality code using your components.
Try Visual Copilot