
Top Related Projects

📊 React Component for ApexCharts

Redefined chart library built with React and D3

nivo provides a rich set of dataviz components, built on top of the awesome d3 and React libraries

A collection of composable React components for building interactive data visualizations

React components for Chart.js, the most popular charting library

Data Visualization Components
Quick Overview
Highcharts-react is an official React wrapper for the Highcharts charting library. It provides a seamless integration of Highcharts into React applications, allowing developers to create interactive and responsive charts with ease.
Pros
- Easy integration with React applications
- Supports all Highcharts modules and chart types
- Automatic chart updates when data or options change
- TypeScript support for improved development experience
Cons
- Requires a separate Highcharts license for commercial use
- Learning curve for developers new to Highcharts
- Limited customization options compared to using Highcharts directly
- Potential performance issues with large datasets or complex charts
Code Examples
- Basic line chart:
import React from 'react';
import Highcharts from 'highcharts';
import HighchartsReact from 'highcharts-react-official';

const options = {
  title: { text: 'My Chart' },
  series: [{ data: [1, 2, 3] }]
};

const LineChart = () => (
  <HighchartsReact highcharts={Highcharts} options={options} />
);
- Updating chart data:
import React, { useState } from 'react';
import Highcharts from 'highcharts';
import HighchartsReact from 'highcharts-react-official';

const DynamicChart = () => {
  const [chartOptions, setChartOptions] = useState({
    series: [{ data: [1, 2, 3] }]
  });

  const updateData = () => {
    setChartOptions({
      series: [{ data: [Math.random(), Math.random(), Math.random()] }]
    });
  };

  return (
    <>
      <HighchartsReact highcharts={Highcharts} options={chartOptions} />
      <button onClick={updateData}>Update Data</button>
    </>
  );
};
- Using Highcharts modules:
import React from 'react';
import Highcharts from 'highcharts';
import HighchartsReact from 'highcharts-react-official';
import highchartsMore from 'highcharts/highcharts-more';

highchartsMore(Highcharts);

const options = {
  chart: { type: 'bubble' },
  series: [{ data: [[1, 2, 3], [4, 5, 6], [7, 8, 9]] }]
};

const BubbleChart = () => (
  <HighchartsReact highcharts={Highcharts} options={options} />
);
Getting Started
-
Install the required packages:
npm install highcharts highcharts-react-official -
Import and use the HighchartsReact component in your React application:
import React from 'react'; import Highcharts from 'highcharts'; import HighchartsReact from 'highcharts-react-official'; const options = { title: { text: 'My First Chart' }, series: [{ data: [1, 2, 3, 4, 5] }] }; const App = () => ( <div> <h1>Highcharts React Demo</h1> <HighchartsReact highcharts={Highcharts} options={options} /> </div> ); export default App; -
Render your React component as usual.
Competitor Comparisons
📊 React Component for ApexCharts
Pros of react-apexcharts
- Free and open-source, suitable for commercial projects without licensing fees
- Lightweight and performant, with a smaller bundle size
- Extensive customization options and interactive features out-of-the-box
Cons of react-apexcharts
- Less mature and established compared to Highcharts
- Smaller community and ecosystem, potentially leading to fewer resources and third-party extensions
- May lack some advanced features or chart types available in Highcharts
Code Comparison
react-apexcharts:
import Chart from 'react-apexcharts'

const App = () => (
  <Chart
    options={options}
    series={series}
    type="bar"
    width={500}
    height={320}
  />
)
highcharts-react:
import Highcharts from 'highcharts'
import HighchartsReact from 'highcharts-react-official'

const App = () => (
  <HighchartsReact
    highcharts={Highcharts}
    options={options}
  />
)
Both libraries offer React wrappers for their respective charting solutions, with similar ease of use. The main differences lie in the underlying charting libraries' features, performance, and licensing models.
Redefined chart library built with React and D3
Pros of Recharts
- Free and open-source, suitable for commercial use without licensing fees
- Built specifically for React, offering seamless integration and performance
- Lightweight and fast, with a smaller bundle size
Cons of Recharts
- Less extensive documentation and community support
- Fewer chart types and customization options out of the box
- May require more custom coding for complex visualizations
Code Comparison
Recharts:
import { LineChart, Line, XAxis, YAxis, CartesianGrid, Tooltip, Legend } from 'recharts';

<LineChart width={600} height={300} data={data}>
  <Line type="monotone" dataKey="value" stroke="#8884d8" />
  <CartesianGrid stroke="#ccc" />
  <XAxis dataKey="name" />
  <YAxis />
</LineChart>
Highcharts React:
import Highcharts from 'highcharts';
import HighchartsReact from 'highcharts-react-official';

const options = {
  series: [{ data: [1, 2, 3] }]
};

<HighchartsReact highcharts={Highcharts} options={options} />
Both libraries offer React-friendly chart components, but Recharts provides a more React-centric API with individual components for chart elements. Highcharts React uses a configuration object approach, which may be more familiar to those with experience in traditional Highcharts usage.
nivo provides a rich set of dataviz components, built on top of the awesome d3 and React libraries
Pros of nivo
- Free and open-source, suitable for commercial projects without licensing costs
- Highly customizable with a wide range of chart types and options
- Built with React and D3, offering smooth integration with React applications
Cons of nivo
- Less extensive documentation compared to Highcharts
- Smaller community and ecosystem, potentially leading to fewer resources and third-party extensions
- May require more setup and configuration for complex visualizations
Code Comparison
nivo example:
import { ResponsiveLine } from '@nivo/line'

const MyChart = ({ data }) => (
  <ResponsiveLine
    data={data}
    margin={{ top: 50, right: 110, bottom: 50, left: 60 }}
    xScale={{ type: 'point' }}
    yScale={{ type: 'linear', min: 'auto', max: 'auto', stacked: true, reverse: false }}
  />
)
Highcharts React example:
import Highcharts from 'highcharts'
import HighchartsReact from 'highcharts-react-official'

const options = {
  series: [{ data: [1, 2, 3] }]
}

const MyChart = () => <HighchartsReact highcharts={Highcharts} options={options} />
Both libraries offer React components for creating charts, but nivo's API is more React-centric, while Highcharts React wraps the traditional Highcharts library.
A collection of composable React components for building interactive data visualizations
Pros of Victory
- Fully open-source and free to use, unlike Highcharts which requires a license for commercial use
- Built specifically for React, offering a more React-centric API and integration
- Highly customizable with a modular architecture, allowing for fine-grained control over chart components
Cons of Victory
- Smaller community and ecosystem compared to Highcharts, potentially leading to fewer resources and third-party extensions
- Less comprehensive documentation and fewer examples than Highcharts
- May require more code to create complex charts, as it favors flexibility over pre-built solutions
Code Comparison
Victory:
import { VictoryBar, VictoryChart, VictoryAxis } from 'victory';

<VictoryChart>
  <VictoryBar data={data} x="quarter" y="earnings" />
  <VictoryAxis tickValues={[1, 2, 3, 4]} tickFormat={["Q1", "Q2", "Q3", "Q4"]} />
</VictoryChart>
Highcharts React:
import Highcharts from 'highcharts';
import HighchartsReact from 'highcharts-react-official';

const options = {
  chart: { type: 'bar' },
  series: [{ data: [1, 2, 3, 4] }],
  xAxis: { categories: ['Q1', 'Q2', 'Q3', 'Q4'] }
};

<HighchartsReact highcharts={Highcharts} options={options} />
React components for Chart.js, the most popular charting library
Pros of react-chartjs-2
- Free and open-source, suitable for commercial projects without licensing costs
- Lightweight and fast, with a smaller bundle size
- Extensive community support and regular updates
Cons of react-chartjs-2
- Less feature-rich compared to Highcharts, with fewer chart types and customization options
- Limited built-in responsiveness and may require additional work for complex responsive designs
Code Comparison
react-chartjs-2:
import { Line } from 'react-chartjs-2';

const data = {
  labels: ['January', 'February', 'March'],
  datasets: [{ data: [65, 59, 80], label: 'Sales' }]
};

<Line data={data} />
highcharts-react:
import Highcharts from 'highcharts';
import HighchartsReact from 'highcharts-react-official';

const options = {
  series: [{ data: [65, 59, 80], name: 'Sales' }]
};

<HighchartsReact highcharts={Highcharts} options={options} />
Both libraries offer React-specific wrappers for their respective charting libraries, making integration into React applications straightforward. react-chartjs-2 uses a more declarative approach with predefined chart components, while highcharts-react relies on a configuration object for chart setup.
Data Visualization Components
Pros of react-vis
- Free and open-source, suitable for commercial projects without licensing costs
- Lightweight and focused on React integration, potentially easier for React developers
- More customizable and flexible for creating unique visualizations
Cons of react-vis
- Less comprehensive documentation and smaller community compared to Highcharts
- Fewer out-of-the-box chart types and features
- Less frequent updates and maintenance
Code Comparison
react-vis:
import {XYPlot, LineSeries} from 'react-vis';

<XYPlot width={300} height={300}>
  <LineSeries data={[{x: 1, y: 10}, {x: 2, y: 5}, {x: 3, y: 15}]} />
</XYPlot>
highcharts-react:
import Highcharts from 'highcharts';
import HighchartsReact from 'highcharts-react-official';

const options = {
  series: [{data: [1, 2, 3]}]
};
<HighchartsReact highcharts={Highcharts} options={options} />
Both libraries offer React-specific implementations for creating charts, but react-vis uses a more declarative approach with individual components for chart elements, while highcharts-react relies on a configuration object passed to a single component.
Convert  designs to code with AI
Introducing Visual Copilot: A new AI model to turn Figma designs to high quality code using your components.
Try Visual CopilotREADME
Highcharts React
Official Highcharts for React

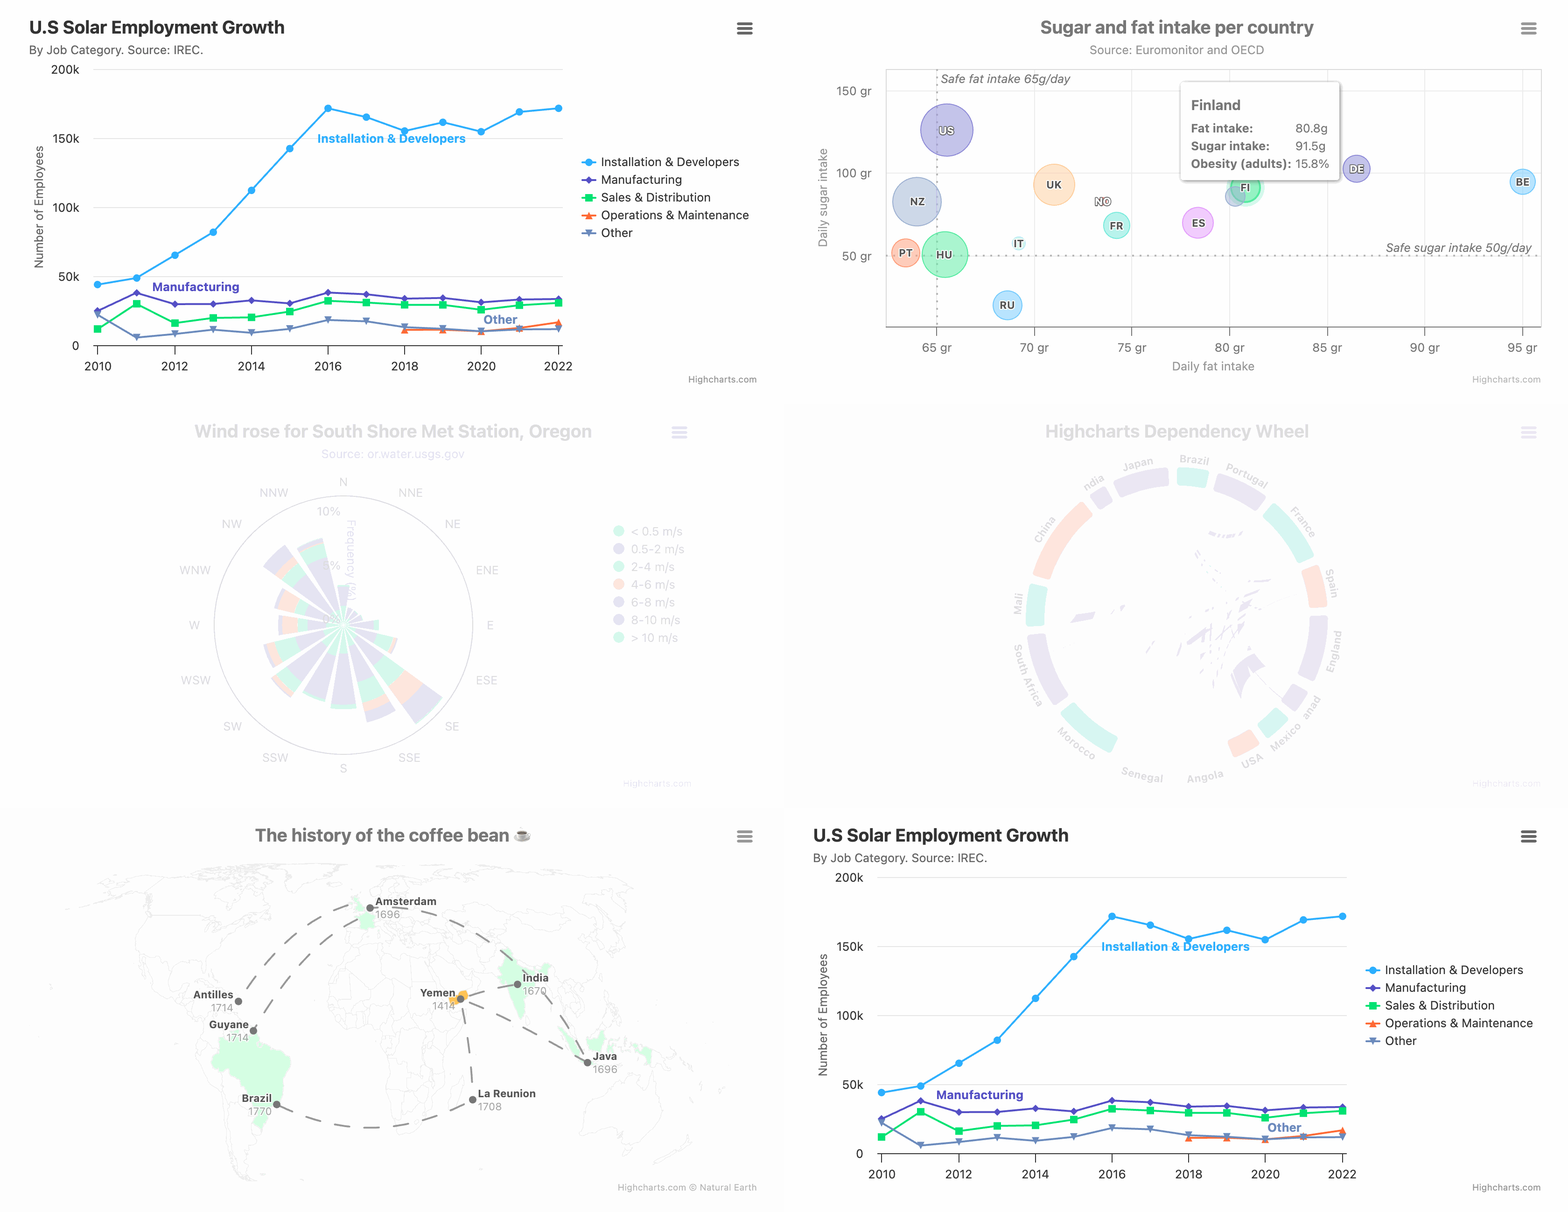
Highcharts for React makes integrating Highcharts data visualizations into your React projects intuitive and aligned with your React workflow, built from the ground up with an API refined for React patterns.



Links
- Official website: www.highcharts.com
- Product page: www.highcharts.com/integrations
- Download: www.highcharts.com/download
- License: www.highcharts.com/license
- Documentation: www.highcharts.com/docs
- Support: www.highcharts.com/support
- Issues: Working repo
Why Highcharts React?
- JSX-Native API - An API built for React with clean syntax and patterns
- Supports All Chart Types - From basic charts to advanced Stock, Gantt, and Maps: covering a wide range of visualizations
- Custom Component Integration - Easily use custom React components in your charts without workarounds
- Full ES Module Support - Built for ESM and tree shaking
- Big Data Ready - WebGL-powered Boost Module lets you render millions of data points if needed
- Accessibility First - World class accessibility features help you reach the widest audience possible.
- Zero Dependencies - Lightweight, and written from scratch with ZERO external dependencies
License
Getting licensed for commercial use makes you production-ready: license, updates and support for business-critical charts. To learn more, please contact our sales team at sales@highcharts.com. You can also review our Standard License Terms and our Annual License at the links below:
Installation
Install Highcharts from npm:
npm install @highcharts/react
Or using yarn:
yarn add @highcharts/react
Note:
highcharts,react, andreact-domare included as peer dependencies and are installed automatically with npm v7+.
Quick Start
import React from 'react';
import { createRoot } from 'react-dom/client';
import { Chart, Title } from '@highcharts/react';
import { LineSeries } from '@highcharts/react/series/Line';
import { ColumnSeries } from '@highcharts/react/series/Column';
import { AreaSeries } from '@highcharts/react/series/Area';

export function Application() {
  return (
    <Chart>
      <Title>Chart with multiple series types</Title>
      <LineSeries data={[2, 4, 3, 1, 5]} name="Line series" color="red" />
      <ColumnSeries
        data={[3, 5, 1, 2, 4]}
        name="Column series"
        color="yellow"
      />
      <AreaSeries data={[4, 2, 1, 5, 3]} name="Area series" color="blue" />
    </Chart>
  );
}

const root = createRoot(document.getElementById('root'));

root.render(<Application />);
Container props
The chart is rendered inside a <div> container. You can pass props directly to
that container using containerProps (for example, to set width/height, add a
className, or attach data attributes):
<Chart
  containerProps={{
    className: 'chart-shell',
    style: { width: '100%', height: '100%' }
  }}
>
  <Title>Full-width chart</Title>
  <Series data={[1, 2, 3]} />
</Chart>
TypeScript
Use ChartOptions for the Chart component options prop.
import { useState } from 'react';
import { Chart, type ChartOptions } from '@highcharts/react';

export function App() {
  const [options] = useState<ChartOptions>({
    series: [{ type: 'line', data: [1, 2, 3] }]
  });

  return <Chart options={options} />;
}
This is the recommended type over importing Options directly from Highcharts.
Use SeriesOptions<'line'> when you want to type an options object for a specific series component.
import { useState } from 'react';
import { Chart, type SeriesOptions } from '@highcharts/react';
import { LineSeries } from '@highcharts/react/series/Line';

export function App() {
  const [options] = useState<SeriesOptions<'line'>>({
    color: 'red'
  });

  return (
    <Chart>
      <LineSeries options={options} />
    </Chart>
  );
}
Provide the series type as the generic parameter to match the options prop of the corresponding series component.
SeriesProps follows the same pattern and defaults to 'line' when no generic parameter is provided.
import type { SeriesProps } from '@highcharts/react';

const props: SeriesProps = {
  color: 'red'
};
Use SeriesProps<'pie'> to type props for a different series component.
For React-specific typing guidance, see the React TypeScript documentation.
Claude Skill
Highcharts React ships with a Claude skill to help you work properly with Highcharts in React projects. To automatically add it to your .claude/skills/ directory, run:
node node_modules/@highcharts/react/scripts/highcharts-react-skill
Alternatively, you can find the skill at node_modules/@highcharts/react/.claude/skills/highcharts-react/SKILL.md.
Documentation
For comprehensive guides and API documentation, visit the Highcharts React documentation, including the TypeScript guide.
Changelog
See the changelog for the latest features, improvements, and fixes.
Support and feedback
We love to learn how you are using Highcharts, and what you would like to see from us in the future.
Join our vibrant community on GitHub, Stack Overflow, Discord, and the Highcharts Forums.
Commercial support packages are available, see Highcharts Advantage.
Top Related Projects
📊 React Component for ApexCharts
Redefined chart library built with React and D3
nivo provides a rich set of dataviz components, built on top of the awesome d3 and React libraries
A collection of composable React components for building interactive data visualizations
React components for Chart.js, the most popular charting library
Data Visualization Components
Convert designs to code with AI
Introducing Visual Copilot: A new AI model to turn Figma designs to high quality code using your components.
Try Visual Copilot