 github-stats
Better GitHub statistics images for your profile, with stats from private repos too
Top Related Projects

:zap: Dynamically generated stats for your github readmes

📊 An infographics generator with 30+ plugins and 300+ options to display stats about your GitHub account and render them as SVG, Markdown, PDF or JSON!

🏆 Add dynamically generated GitHub Stat Trophies on your readme

🔥 Stay motivated and show off your contribution streak! 🌟 Display your total contributions, current streak, and longest streak on your GitHub profile README

A tool to generate your GitHub summary card for profile README

It counts how many times your GitHub profile has been viewed. Free cloud micro-service.
Quick Overview
GitHub Stats is a project that generates GitHub stats cards for your profile README. It creates customizable SVG images displaying various statistics about your GitHub activity, including top languages, commit frequency, and star counts. The project aims to provide an easy way to showcase your GitHub contributions and activity in a visually appealing manner.
Pros
- Highly customizable, allowing users to tailor the appearance of their stats cards
- Automatically updates stats, ensuring the displayed information is always current
- Supports both light and dark themes to match different README styles
- Easy to integrate into GitHub profile READMEs with minimal setup
Cons
- Requires setting up a GitHub Actions workflow, which may be challenging for some users
- Limited to displaying GitHub-specific statistics only
- May not accurately represent all contributions, especially for users who work on private repositories
- Can potentially slow down the loading of profile READMEs due to external image generation
Getting Started
To use GitHub Stats in your profile README:
- Fork the
jstrieb/github-statsrepository. - Go to the "Actions" tab in your forked repository and enable workflows.
- Edit the
README.mdfile in your fork, replacingjstriebwith your GitHub username:


- Commit the changes and wait for the GitHub Action to generate your stats cards.
- Copy the markdown from step 3 into your profile README, replacing
your-usernamewith your actual GitHub username.
Competitor Comparisons
:zap: Dynamically generated stats for your github readmes
Pros of github-readme-stats
- More customizable with themes, icons, and layout options
- Provides dynamic cards for languages, stats, and top repositories
- Easier to integrate with just a single line of markdown
Cons of github-readme-stats
- Relies on external hosting, which may have uptime or performance issues
- Limited to predefined card types and metrics
Code Comparison
github-readme-stats:
[](https://github.com/anuraghazra/github-readme-stats)
github-stats:
import github_stats
user = github_stats.GitHubUser("jstrieb")
print(user.to_str())
github-readme-stats offers a simpler integration with a single line of markdown, while github-stats requires Python code to generate statistics.
github-readme-stats focuses on visual representation with customizable cards, whereas github-stats provides more raw data and flexibility for custom processing.
github-stats allows for local generation and hosting of statistics, which can be beneficial for privacy and control, while github-readme-stats relies on external services.
Both projects aim to display GitHub statistics, but they cater to different use cases and levels of customization. The choice between them depends on the specific needs of the user, such as ease of integration, visual appeal, or data control.
📊 An infographics generator with 30+ plugins and 300+ options to display stats about your GitHub account and render them as SVG, Markdown, PDF or JSON!
Pros of metrics
- More comprehensive and customizable, offering a wider range of metrics and visualizations
- Supports multiple CI/CD platforms and can be integrated into various workflows
- Actively maintained with frequent updates and a larger community
Cons of metrics
- More complex setup and configuration process
- Requires more resources to run due to its extensive features
- Steeper learning curve for users new to GitHub metrics
Code comparison
metrics:
- uses: lowlighter/metrics@latest
  with:
    token: ${{ secrets.METRICS_TOKEN }}
    config_timezone: Europe/Paris
    plugin_languages: yes
    plugin_languages_ignored: html, css
github-stats:
- uses: jstrieb/github-stats@v1
  with:
    GITHUB_TOKEN: ${{ secrets.GITHUB_TOKEN }}
    EXCLUDED_LANGS: html,css
    EXCLUDED_REPOS: jstrieb/github-stats
Both repositories provide GitHub statistics and visualizations, but metrics offers a more feature-rich and flexible solution at the cost of increased complexity. github-stats is simpler and easier to set up but has fewer customization options. The code comparison shows that metrics requires more configuration parameters, reflecting its broader range of features.
🏆 Add dynamically generated GitHub Stat Trophies on your readme
Pros of github-profile-trophy
- Visually appealing trophies for GitHub profile achievements
- Easy to customize and integrate into GitHub README
- Provides a gamification aspect to GitHub contributions
Cons of github-profile-trophy
- Limited to predefined trophy types and achievements
- May not provide as detailed statistics as github-stats
- Requires manual updates to keep trophies current
Code Comparison
github-profile-trophy:
[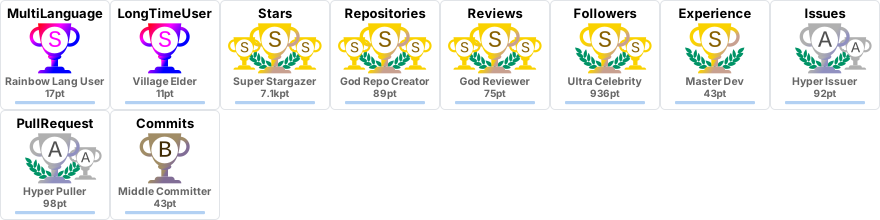](https://github.com/ryo-ma/github-profile-trophy)
github-stats:
<a href="https://github.com/jstrieb/github-stats">
<img src="https://github.com/jstrieb/github-stats/blob/master/generated/overview.svg#gh-dark-mode-only" />
<img src="https://github.com/jstrieb/github-stats/blob/master/generated/languages.svg#gh-dark-mode-only" />
</a>
Summary
github-profile-trophy offers an eye-catching, gamified approach to showcasing GitHub achievements, making it ideal for users who want to add a fun element to their profile. It's easy to implement but limited in customization and detail.
github-stats, on the other hand, provides more comprehensive statistics and language breakdowns, making it better suited for users who want to display detailed information about their GitHub activity and coding preferences.
Both projects serve different purposes and can be used together to create a more comprehensive GitHub profile.
🔥 Stay motivated and show off your contribution streak! 🌟 Display your total contributions, current streak, and longest streak on your GitHub profile README
Pros of github-readme-streak-stats
- Focuses specifically on GitHub contribution streaks, providing a visually appealing way to showcase consistency
- Offers extensive customization options for colors, themes, and layout
- Regularly updated with new features and improvements
Cons of github-readme-streak-stats
- Limited to streak statistics, lacking broader GitHub activity metrics
- Requires a separate service to generate and host the streak images
Code Comparison
github-readme-streak-stats:
def get_streak_count(contributions):
    streak = 0
    for day in contributions:
        if day.count > 0:
            streak += 1
        else:
            break
    return streak
github-stats:
def get_total_contributions(contributions):
    return sum(day.count for day in contributions)
The code snippets highlight the different focus areas of each project. github-readme-streak-stats calculates consecutive contribution days, while github-stats provides a broader overview of total contributions.
Both projects offer valuable insights into GitHub activity, with github-readme-streak-stats excelling in visualizing contribution streaks and github-stats providing a more comprehensive set of statistics. The choice between them depends on the specific metrics a user wants to highlight in their GitHub profile.
A tool to generate your GitHub summary card for profile README
Pros of github-profile-summary-cards
- Offers a wider variety of visual cards and statistics
- Provides language-specific contribution graphs
- Easier to customize and configure through a YAML file
Cons of github-profile-summary-cards
- Requires more setup and configuration
- May have a steeper learning curve for beginners
- Limited to predefined card types and layouts
Code Comparison
github-profile-summary-cards:
name: GitHub-Profile-Summary-Cards
on:
  schedule:
    - cron: "0 0 * * *"
  workflow_dispatch:
jobs:
  build:
    runs-on: ubuntu-latest
    steps:
      - uses: actions/checkout@v2
      - uses: vn7n24fzkq/github-profile-summary-cards@release
        env:
          GITHUB_TOKEN: ${{ secrets.GITHUB_TOKEN }}
github-stats:
name: Generate Stats Images
on:
  schedule:
    - cron: "0 0 * * 0"
  workflow_dispatch:
jobs:
  build:
    runs-on: ubuntu-latest
    steps:
      - uses: actions/checkout@v2
      - uses: jstrieb/github-stats@v1
        with:
          GITHUB_TOKEN: ${{ secrets.GITHUB_TOKEN }}
Both projects use GitHub Actions to generate statistics, but github-profile-summary-cards offers more customization options through its YAML configuration. github-stats has a simpler setup but provides fewer visual options. The choice between the two depends on the user's preference for customization versus simplicity.
It counts how many times your GitHub profile has been viewed. Free cloud micro-service.
Pros of github-profile-views-counter
- Simple setup with minimal configuration required
- Provides a real-time count of profile views
- Easily customizable badge design
Cons of github-profile-views-counter
- Limited to tracking profile views only
- Doesn't provide detailed statistics or visualizations
- May require external hosting for optimal performance
Code Comparison
github-profile-views-counter:

github-stats:
name: GitHub Stats
uses: jstrieb/github-stats@v1.0.0
with:
  USERNAME: ${{ github.repository_owner }}
  TOKEN: ${{ secrets.GITHUB_TOKEN }}
github-profile-views-counter focuses on providing a simple, easy-to-implement view counter for GitHub profiles. It offers a straightforward solution for users who want to display their profile view count without additional complexity.
On the other hand, github-stats provides a more comprehensive set of statistics and visualizations for GitHub profiles and repositories. It generates detailed graphs and charts, offering a broader overview of a user's GitHub activity and contributions.
While github-profile-views-counter excels in simplicity and ease of use, github-stats offers more in-depth analytics and visual representations of GitHub data. The choice between the two depends on the user's specific needs and desired level of detail in their GitHub profile statistics.
Convert  designs to code with AI
Introducing Visual Copilot: A new AI model to turn Figma designs to high quality code using your components.
Try Visual CopilotREADME
GitHub Stats Visualization


Generate visualizations of GitHub user and repository statistics with GitHub Actions. Visualizations can include data from private repositories, and from repositories you have contributed to, but do not own.
Generated images automatically switch between GitHub light theme and GitHub dark theme.
Background
When someone views a GitHub profile, it is often because they are curious about the user's open-source contributions. Unfortunately, that user's stars, forks, and pinned repositories do not necessarily reflect the contributions they make to private repositories. The data likewise does not present a complete picture of the user's total contributions beyond the current year.
This project aims to collect a variety of profile and repository statistics using the GitHub API. It then generates images that can be displayed in repository READMEs, or in a user's Profile README. It also dumps all statistics to a JSON file that can be used for further data analysis.
Since this project runs on GitHub Actions, no server is required to regularly regenerate the images with updated statistics. Likewise, since the user runs the analysis code themselves via GitHub Actions, they can use their GitHub access token to collect statistics on private repositories that an external service would be unable to access.
Disclaimer
The GitHub statistics API returns inaccurate results in some situations:
- Total lines of code modified may be too high or too low
- GitHub counts changes to files like
package-lock.jsonthat may inflate the line count in surprising ways - On the other hand, GitHub refuses to count lines of code for repositories with more than 10,000 commits, so contributions to those will not be reflected in the data at all
- The GitHub API endpoint for computing contributor statistics no longer
works reliably, so we
fall back on computing the statistics ourselves by cloning each repository
locally and tallying lines changed with the
gitCLI- Our computed totals likely under-count relative to GitHub's, since theirs correctly attribute authorship for contributions to pull requests with several authors that end up squashed and merged by just one author
- They also correctly attribute commits we may miss if they are made with old email addresses no longer connected to the account
- GitHub counts changes to files like
- Repository view count statistics often seem too low, and many referring sites
are not captured
- If you lack permissions to access the view count for a repository, it will be tallied as zero views â this is common for external repositories where your only contribution is making a pull request
- Only repositories with commit contributions are counted, so if you only open
an issue on a repo, it will not show up in the statistics
- Repos you created and own may not be counted if you never commit to them, or if the committer email is not connected to your GitHub account
If the calculated numbers seem strange, run the CLI locally and dump JSON output to determine which repositories are skewing the statistics in unexpected ways. See below for tips.
Installation
To make your own statistics images: make a copy of this repository, make a GitHub API token, add the token to the repository, run the Actions workflow, and retrieve the images.
- Make a "classic" personal access token with
read:user,user:email, andrepopermissions.- Navigate to the personal access tokens (classic)
page. Open that link in a new tab, or
proceed with the steps below.
- Click your avatar in the top right corner, then "Settings" on the menu that drops down.
- Click "Developer settings" from the menu on the left.
- Click "Personal access tokens", then "Tokens (classic)" from the menu on the left.
- Click "Generate new token" in the top right, then "Generate new token (classic)" in the menu that drops down.
- Set the expiration date to "none" (unless you want to periodically regenerate this token).
- Check
read:user,user:email, andrepopermissions.read:userandrepopermissions are necessary for reading user and repository metadata to calculate statistics.user:emailpermission is necessary for correctly attributing commits to the user when cloning repositories locally to compute lines of code changed.
- Click the green "Generate token" button at the bottom.
- Copy the token and save it somewhere. If you lose it, you will not be able to access it again, and will have to regenerate a new one. I keep mine saved along with the GitHub entry in my password manager.
- Some users report that it can take some time for the personal access token to take effect. For more information, see #30.
- Navigate to the personal access tokens (classic)
page. Open that link in a new tab, or
proceed with the steps below.
- Create a copy of this repository by clicking
here.
- Equivalently, click the big, green "Use this template" button at the top left of the page, then click "Create a new repository."
- Note: this is not the same as forking a copy because it copies everything fresh, without the huge commit history.
- Create a new repository secret named
ACCESS_TOKENwith your personal access token from the first step.- Go to the "New secret" page for your copy of this repository by clicking
this link.
- If the link doesn't work, try clicking it from your copy of this repository.
- Alternatively, go to the page manually.
- Click "Settings" for your copy of this repository.
- Click "Secrets and variables" on the left, then "Actions" from the menu that drops down.
- Click the green "New repository secret" button on the "Actions secrets and variables" page.
- Name your secret
ACCESS_TOKEN. - Paste your personal access token from step 1 into the large "Secret" text box.
- Go to the "New secret" page for your copy of this repository by clicking
this link.
- (Optional) Make other secrets for more configuration.
- To exclude some repositories from the aggregate statistics, add them
(separated by commas) to a secret called
EXCLUDE_REPOS.- To prevent your copy of this repository from showing up in your statistics, add the name of your copy of the repo to this list.
- To exclude some languages from the aggregate statistics, add them
(separated by commas) to a secret called
EXCLUDE_LANGS.- The languages are case insensitive, and can include spaces.
- Language names can be found either in a local stats file generated by the CLI, or in the list used by GitHub linguist (which powers their language analysis on the back end).
- Lists for
EXCLUDE_REPOSandEXCLUDE_LANGScan use globbing patterns. For example, to exclude all repos by user "jstrieb", addjstrieb/*toEXCLUDE_REPOS. - These can also be set directly in the Actions workflow, but you should set them as secrets if you want to keep the repository names or languages private.
- Other configuration options can be set as environment variables or command line arguments by directly editing the Actions workflow.
- To exclude some repositories from the aggregate statistics, add them
(separated by commas) to a secret called
- Go to the Actions
page and click "Run
Workflow" on the right side of the screen to generate images for the first
time.
- They automatically regenerate every 24 hours, but they can be manually regenerated by running the workflow this way.
- Take a look at the images that have been created on the
generatedbranch.- The
overview.svgfile. - The
languages.svgfile.
- The
- To add the statistics to your GitHub profile README, copy and paste the
following lines of code into your markdown content.
- Replace
[USERNAME]in the links below with your own username.
    [Created by `jstrieb/github-stats`.](https://github.com/jstrieb/github-stats) - Replace
- Star this repo if you like it!


Analyzing the Data
Using the github-stats CLI (available on the
releases page) to
run locally, you can dump raw statistics data to a JSON file using the
--json-output-file command-line argument.
# Instructions for Linux. Change the filename at the end of the URL for macOS.
sudo curl \
    --location \
    --output '/usr/local/bin/github-stats' \
    'https://github.com/jstrieb/github-stats/releases/latest/download/github-stats_x86_64-linux'
sudo chmod +x /usr/local/bin/github-stats

github-stats --version

github-stats --access-token [YOUR API KEY] --json-output-file stats.json --debug
Then, you can import the JSON file into your programming language of choice and
start analyzing. My preference is to use jq
from the command line. The examples below assume the JSON file is stored in
stats.json.
List All
List all repositories, sorted with most-viewed at the bottom.
jq '.repositories | sort_by(.views) | del(.[].languages)' stats.json
In that command, replace .views with any other field name (such as
.lines_changed or .stars) to sort by that field instead. The command
removes the languages field (using del()) because it can clutter the output,
making it hard to read.
List Languages
List all languages, sorted with most-used at the bottom.
jq --raw-output '
  [.repositories[].languages[]]
    | group_by(.name)
    | sort_by([.[].size] | add)
    | .[]
    | "\(.[0].name): \([.[].size] | add)"
' stats.json
Support the Project
If this project is useful to you, please support it!
- Star the repository (and follow me on GitHub for more)
- Share and upvote on sites like Twitter, Reddit, and Hacker News
- Report any bugs, glitches, or errors that you find
- Check out my other projects
These things motivate me to keep sharing what I build, and they provide validation that my work is appreciated! They also help me improve the project. Thanks in advance!
If you are insistent on spending money to show your support, I encourage you to instead make a generous donation to one of the following organizations.
Project Status
This project is actively maintained, but not actively developed. In other words, I will fix bugs, but will rarely add features (if at all). If there are no recent commits, it means that everything has been running smoothly!
GitHub's APIs often have unexpected errors, downtime, and strange, intermittent, undocumented behavior. Issues generating statistics images often resolve themselves within a day or two, without any changes to this code or repository.
If you want to contribute to the project, please open an issue and discuss first. Pull requests that are not discussed with me ahead of time may be ignored. It's nothing personal, I'm just busy, and reviewing others' code is nowhere near as fun as working on other projects.
Even if something were to happen to me, and I could not continue to work on the project, it will continue to work as long as the GitHub API endpoints it uses remain active and unchanged.
Related Projects
- Inspired by a desire to improve upon anuraghazra/github-readme-stats
- Uses GitHub Octicons to precisely match the GitHub UI
Top Related Projects
:zap: Dynamically generated stats for your github readmes
📊 An infographics generator with 30+ plugins and 300+ options to display stats about your GitHub account and render them as SVG, Markdown, PDF or JSON!
🏆 Add dynamically generated GitHub Stat Trophies on your readme
🔥 Stay motivated and show off your contribution streak! 🌟 Display your total contributions, current streak, and longest streak on your GitHub profile README
A tool to generate your GitHub summary card for profile README
It counts how many times your GitHub profile has been viewed. Free cloud micro-service.
Convert designs to code with AI
Introducing Visual Copilot: A new AI model to turn Figma designs to high quality code using your components.
Try Visual Copilot